
 Spot ETFs See $1.42B Outflow as Price Drops to $73K")
Key Takeaways
- US-listed spot Bitcoin ETFs experienced net redemptions totaling $1.42 billion over the past week—ranking as the third-highest weekly withdrawal since inception.
- BlackRock’s IBIT fund was responsible for approximately $966 million of these outflows, including a $448 million single-day redemption.
- ETF issuers liquidated roughly 19,021 BTC throughout the week, representing the equivalent of 42 days’ worth of mining production.
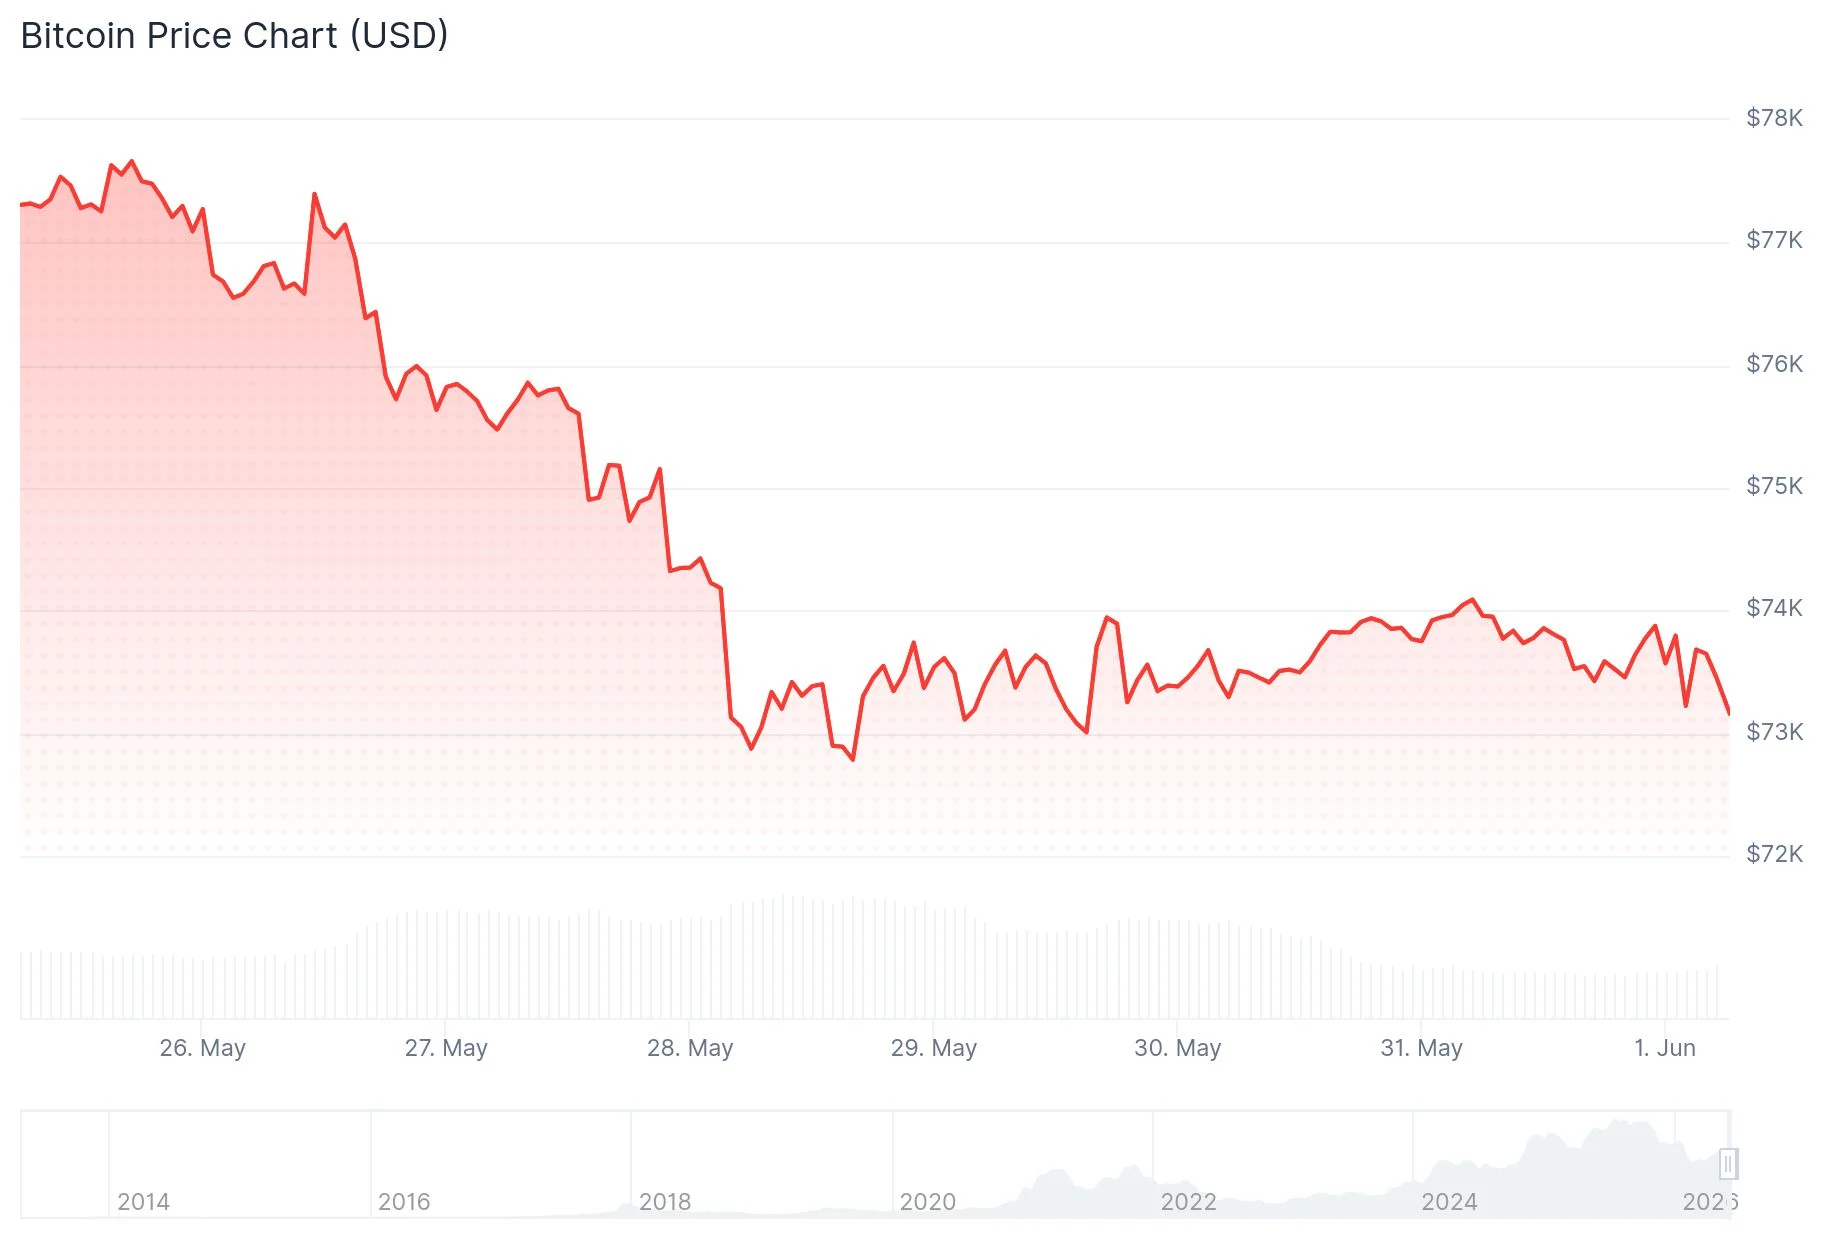
- Bitcoin’s value declined more than 4% over the seven-day period, settling near the $73,000 level.
- Broader macroeconomic factors—persistent inflation concerns, climbing Treasury yields, and international tensions—are fueling the downturn.
Bitcoin experienced a decline exceeding 4% throughout the past week, settling around the $73,000 mark after momentarily surpassing $82,000 in May. This downward movement coincided with US spot Bitcoin ETFs registering $1.42 billion in net redemptions—representing the third-largest weekly outflow figure recorded since these investment vehicles debuted, based on current tracking data.
This marked the third consecutive week of substantial withdrawals. Combined, the three-week cumulative outflow total has now surpassed $3.5 billion.
BlackRock’s IBIT Dominates Redemption Activity
BlackRock’s IBIT fund, which holds the largest asset base among spot Bitcoin ETFs, spearheaded the selling wave. The product witnessed approximately $966 million in net outflows over the seven-day span. During its most severe single session, redemptions reached $448 million.
When investors redeem ETF shares, fund managers are required to liquidate the corresponding Bitcoin holdings to fulfill those requests. Throughout last week, all spot ETF providers collectively sold approximately 19,021 BTC—a volume equivalent to what miners produce over a 42-day period.
Cryptocurrency analyst Ali Charts (@alicharts) identified an important technical threshold, noting: “I’m watching $72,650 closely on Bitcoin, as the MVRV Pricing Bands continue to identify it as a critical support level. If it fails, the next major demand zone sits between $54,300 and $51,000.” This level sits marginally below Bitcoin’s current trading range.

Understanding the Selling Pressure
Macroeconomic conditions are the primary catalyst. Inflation figures published in May diminished market expectations surrounding potential Federal Reserve interest rate reductions. Elevated interest rates enhance the attractiveness of risk-free instruments such as Treasury securities, consequently diminishing investor appetite for volatile assets like Bitcoin.
Geopolitical instability—including the possibility of renewed tensions between the US and Iran—has compounded the pressure. Increasing oil prices connected to these tensions could further accelerate inflation, thereby reducing the probability of rate cuts.
Market analyst AlphaBTC (@mark_cullen) provided his short-term outlook, indicating he’s monitoring for a potential rebound toward $79,000 before an anticipated decline into the low $60,000 range later during the summer months.
The Crypto Fear & Greed Index maintained readings within “fear” territory across the entire week.
One encouraging sign: the market’s ability to absorb 19,021 BTC from spot sellers without triggering a more severe price collapse indicates persistent demand exists at present valuation levels.
Bitcoin was changing hands near $73,000 according to the most recent market data, with the $72,650 MVRV support threshold remaining under close observation by technical analysts.
Get 3 Free Stock Ebooks
Discover top-performing stocks in AI, Crypto, and Technology with expert analysis.
- Top 10 AI Stocks - Leading AI companies
- Top 10 Crypto Stocks - Blockchain leaders
- Top 10 Tech Stocks - Tech giants

