



Key Highlights
- ADA currently hovers around $0.196 following approximately 14% weekly gains.
- Technical analysis indicates possible 147% surge to $0.47 after breaking above descending channel pattern.
- Large holders added 110 million ADA tokens to their portfolios starting Friday, according to Santiment analytics.
- Futures market data reveals emerging bullish bias with funding rates moving into positive territory.
- Critical resistance zones identified at $0.20, followed by $0.22, $0.25, and $0.30 levels.
Cardano (ADA) currently changes hands around $0.196 following impressive two-week performance that delivered double-digit percentage gains. While the token still trades approximately 94% beneath its historic peak of $3.10, near-term price action demonstrates strengthening momentum.
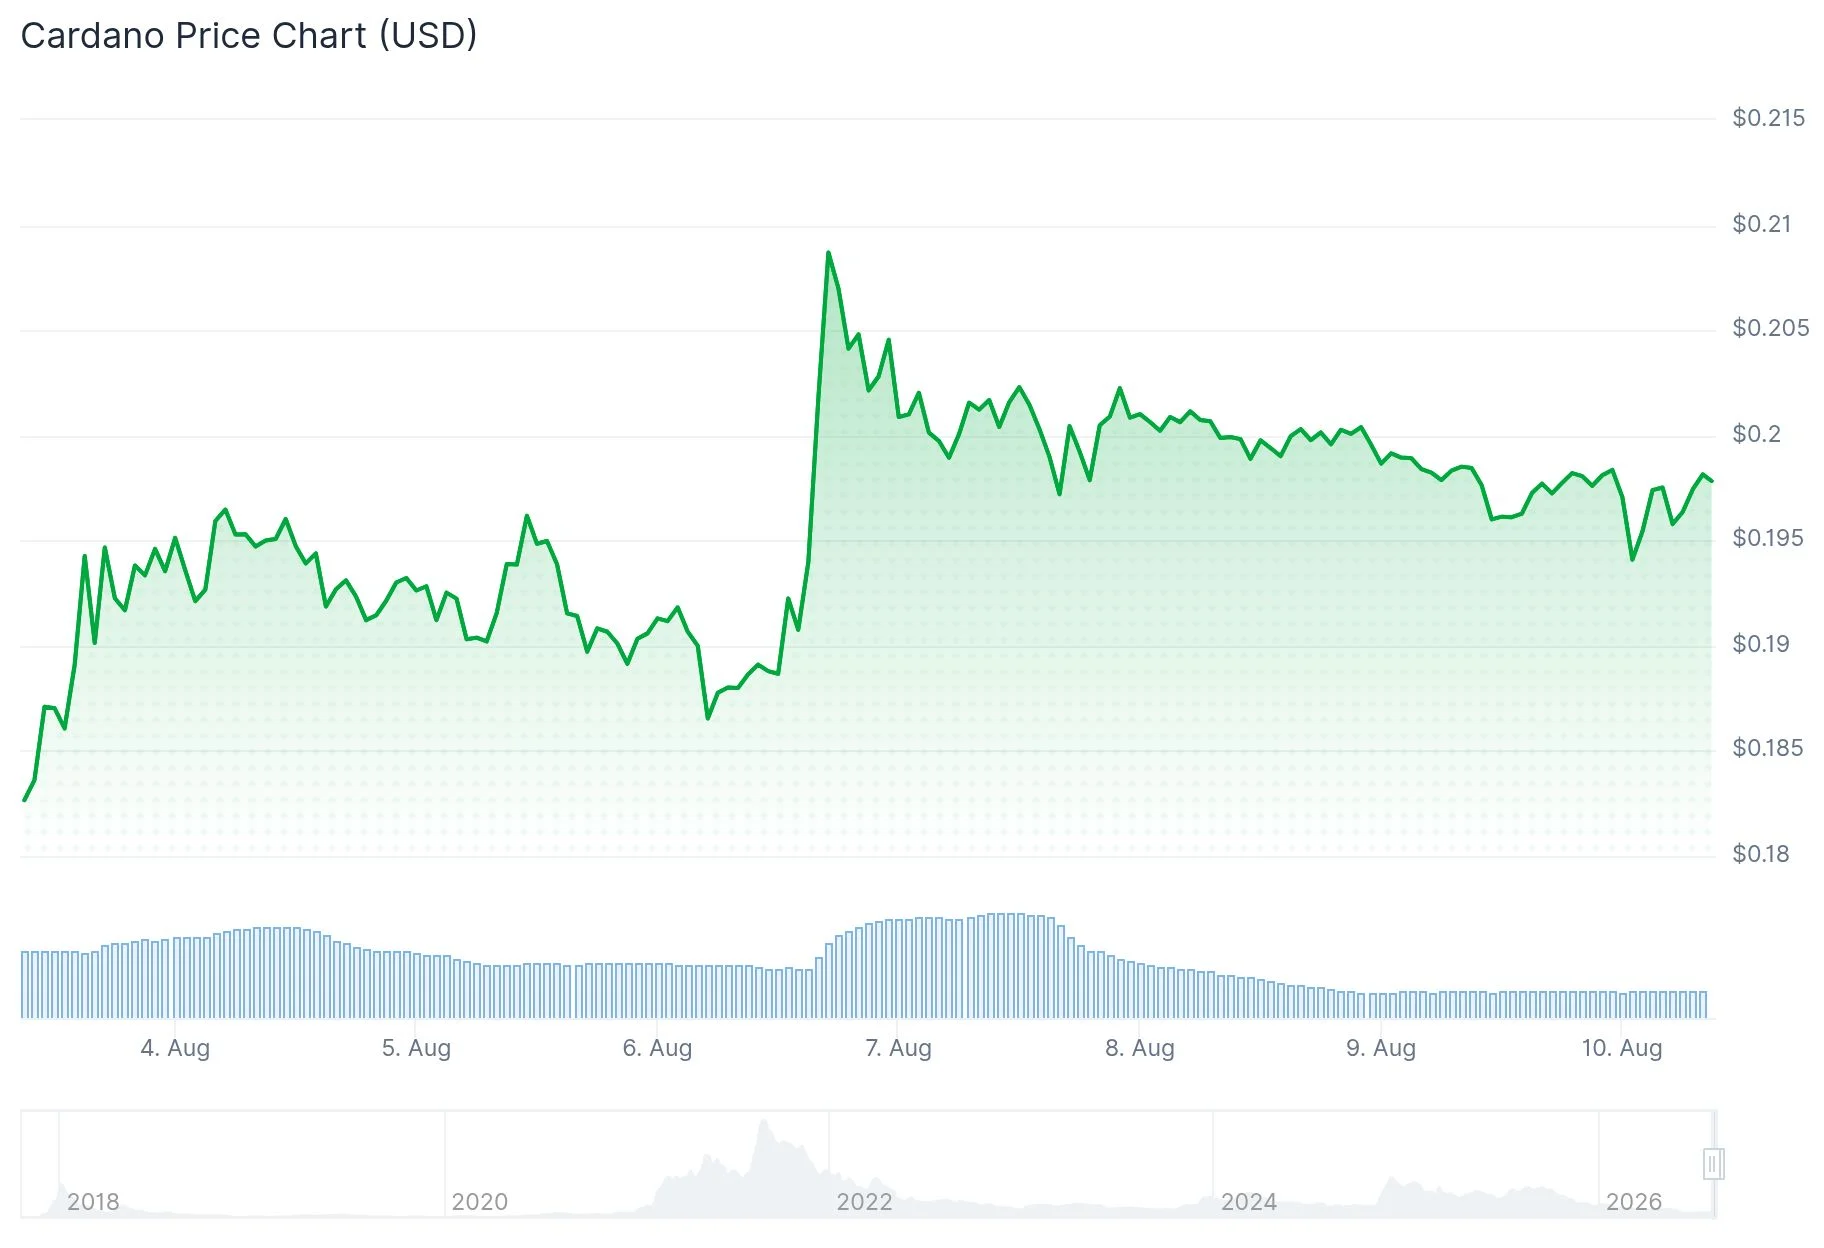
The cryptocurrency advanced roughly 14% throughout the past week. Current pricing maintains position above the 50-day Exponential Moving Average (EMA) positioned at $0.180, recognized by market technicians as critical support territory.
A cryptocurrency market analyst indicates Cardano successfully escaped from an extended descending channel pattern. The initial breakout above the channel’s resistance boundary generated approximately 13% appreciation. Should ADA sustain trading above this breakout region, technical projections point toward $0.47, representing nearly 147% potential appreciation from present valuations.
Prevailing 2026 price predictions for ADA cluster between $0.22 and $0.30. These projections indicate potential returns ranging from 11% to 52% relative to current market pricing.
Large Holders Drive Accumulation Trend
Analysis from Santiment’s Supply Distribution metrics reveals significant buying activity among major wallet addresses. Holders controlling between 1 million and 100 million ADA tokens collectively acquired 110 million ADA beginning Friday.

Notwithstanding the price bounce, large transaction volumes haven’t matched previous activity levels. Transfers exceeding 100,000 ADA decreased to merely seven during the recent timeframe, contrasting sharply with peaks ranging from 50 to 100 transactions during more dynamic market phases.
Market commentator Mr Brownstone (@GunsRoses1987) shared analysis on X suggesting ADA occupies a prolonged accumulation phase. He presented two potential trajectories: either the current bottom has formed and a higher low will initiate the subsequent phase of a multi-year bull cycle, or one additional decline beneath $0.138 could materialize before a meaningful trend reversal. His disclosed strategy involves dollar-cost averaging below $0.22 while maintaining positions through market fluctuations, embracing what he describes as a “2030 mindset.”
Futures Market Data Shows Bullish Lean
Information from CoinGlass indicates ADA’s OI-Weighted Funding Rate transitioned to positive territory Saturday, registering 0.0038% on Monday. This configuration indicates long position holders are compensating short sellers, reflecting optimistic sentiment within derivatives markets.
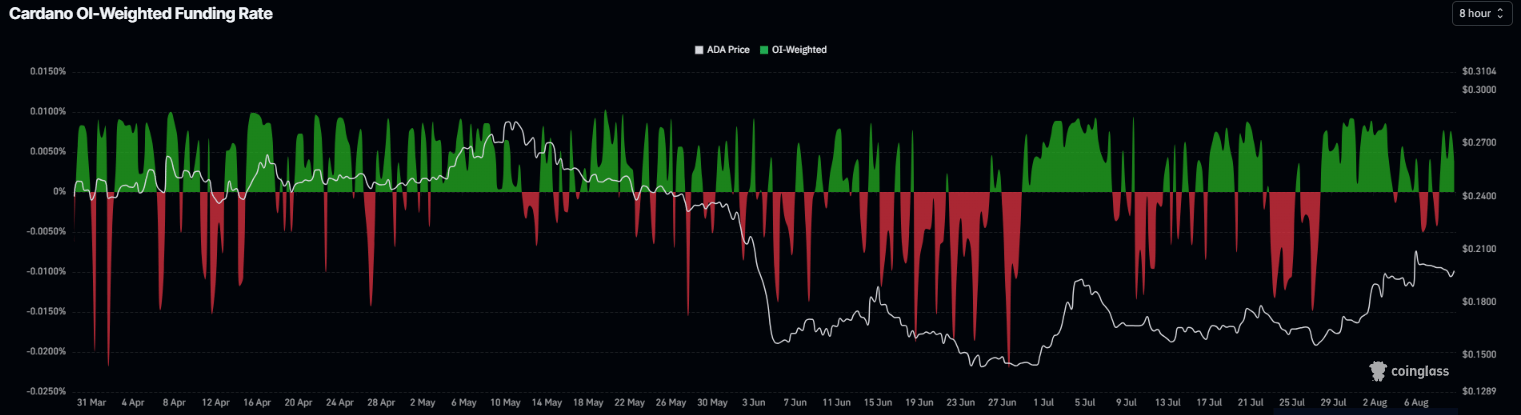
The long-to-short ratio measured 0.99 on Monday, marginally beneath the neutral threshold of 1.0. Advancement beyond 1.0 would confirm long positions exceed short positions numerically.
The Relative Strength Index registers approximately 64, while the MACD indicator displays positive momentum, both reinforcing the ongoing recovery trajectory.
Significant resistance barriers above present levels include $0.213, $0.231, and $0.236. Consistent breakthrough above this resistance cluster would be required to approach $0.30 territory.
Current market data indicates ADA trading at $0.196, maintaining ground above the 38.2% Fibonacci retracement positioned at $0.195.
Get 3 Free Stock Ebooks
Discover top-performing stocks in AI, Crypto, and Technology with expert analysis.
- Top 10 AI Stocks - Leading AI companies
- Top 10 Crypto Stocks - Blockchain leaders
- Top 10 Tech Stocks - Tech giants


