
 Technical Indicators Suggest Accumulation Phase as TD Buy Signal Emerges")
Key Takeaways
- Net position delta for Dogecoin continues climbing despite price remaining near recent support levels, indicating persistent accumulation.
- The percentage of profitable DOGE holders has declined significantly, a condition often observed during market bottoming processes.
- Technical analyst Ali Charts identified a TD buy signal appearing on DOGE charts, suggesting possible trend reversal.
- Weekly price action reveals DOGE establishing higher lows, a technical pattern that preceded significant upward movements historically.
- Historical data shows July has been favorable for DOGE performance, with positive returns in four out of six recent years.
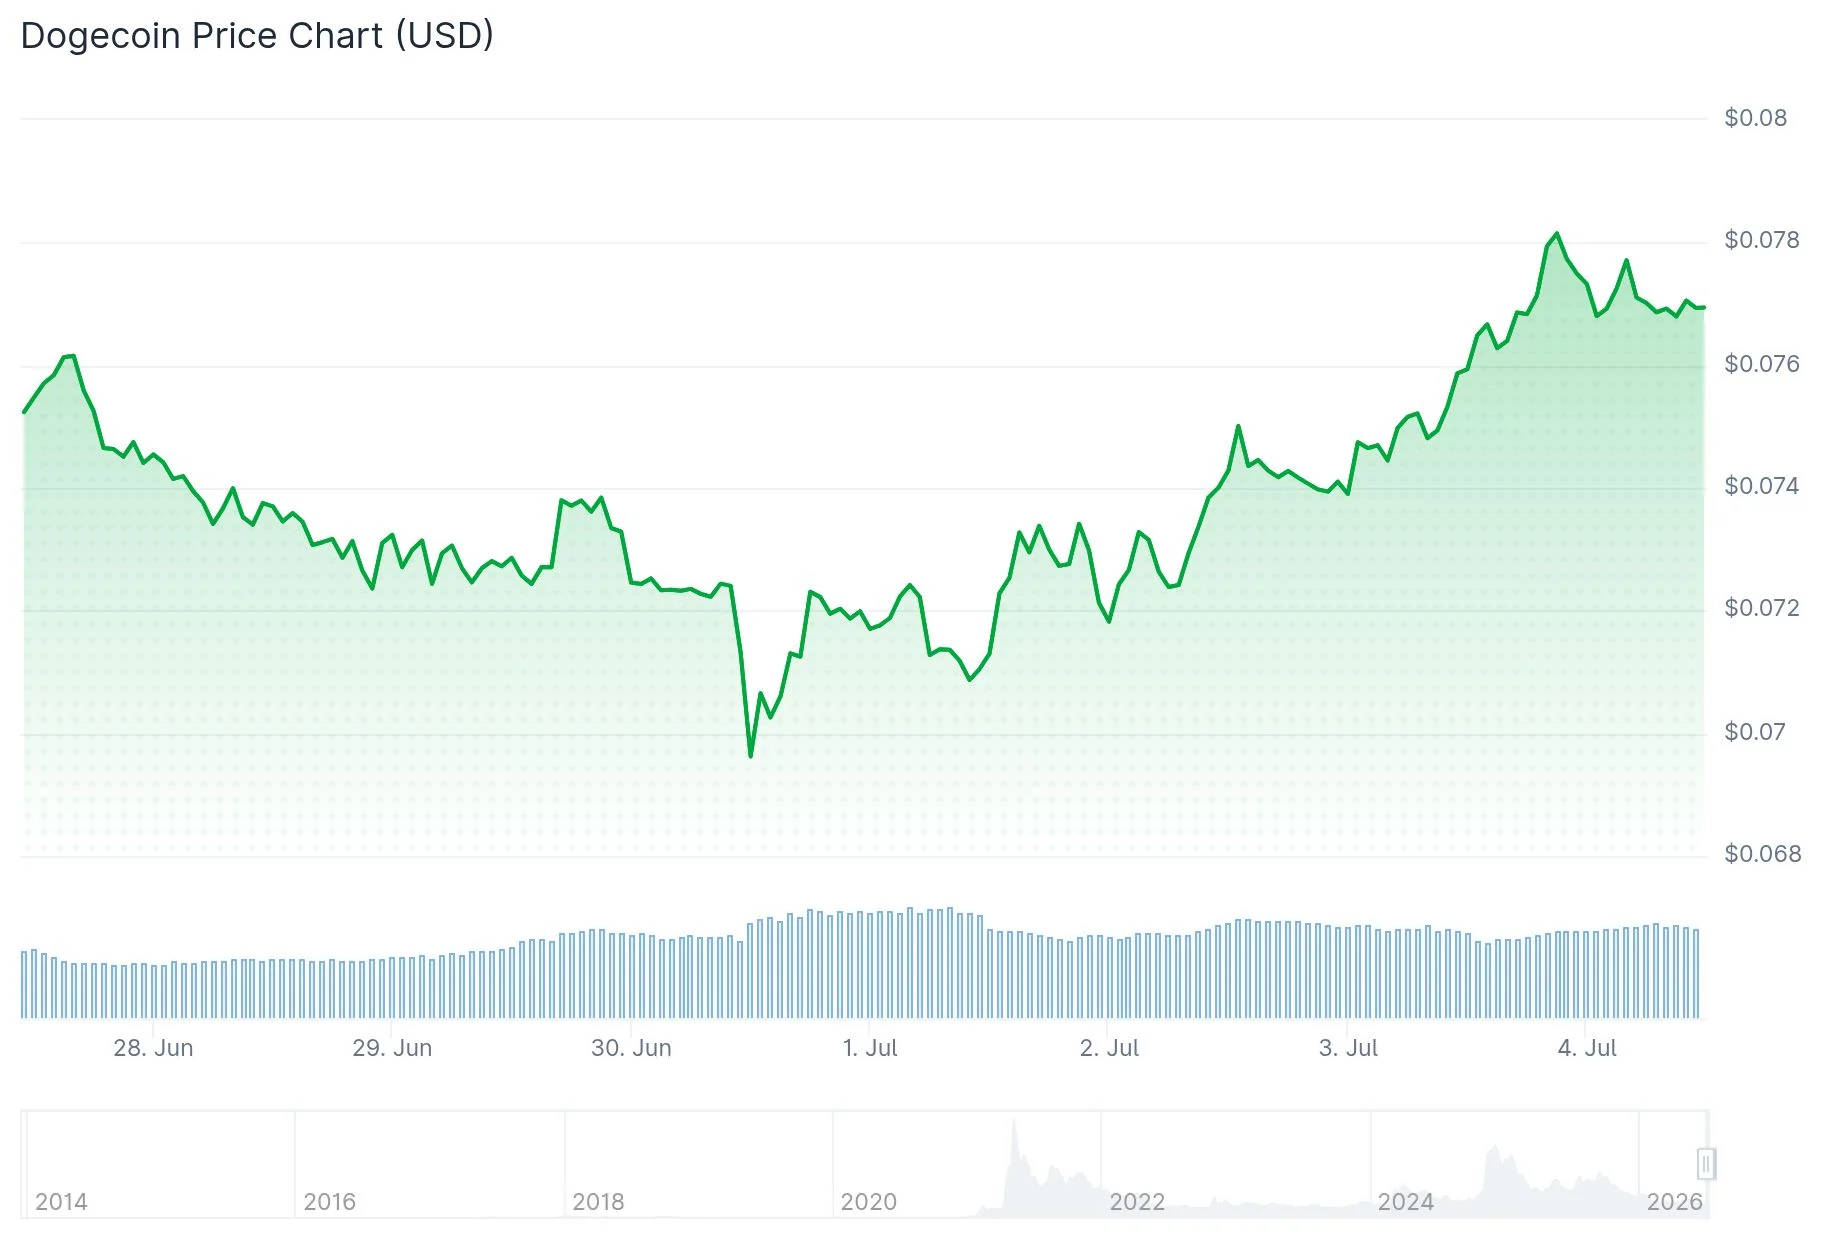
Dogecoin currently trades at approximately $0.07535, registering a 1.96% increase over the past 24-hour period. The meme coin’s market capitalization stands at roughly $12.85 billion, while daily trading volumes hover around $697 million. Multiple technical indicators and blockchain metrics are currently attracting trader interest.
Crypto analyst CW highlighted an intriguing divergence: Dogecoin’s net position delta continues its upward trajectory even as prices have declined. This metric measures the equilibrium between buying and selling forces in the market. When the delta rises during price weakness, it indicates investors are accumulating positions rather than distributing.
According to CW’s assessment, this buying pressure has been accumulating over an extended period. The analyst suggests this sustained demand could fuel a more substantial price expansion if the trend persists.
In a separate observation, analyst Cryptollica presented data demonstrating that DOGE supply currently in profit has fallen into what they characterized as a “deep bottom zone.” This indicates a reduced number of holders maintaining unrealized gains at present price levels, with many previous buyers now experiencing paper losses.
Cryptollica explained this configuration typically emerges following prolonged distribution phases, after speculative short-term participants have exited their positions. Many market participants view this condition as suggesting diminished selling pressure ahead.

TD Sequential Buy Signal Identified by Technical Analyst
Crypto analyst Ali Charts announced via X that Dogecoin has generated a TD buy signal, commenting: “Things are about to go wild.” TD Sequential indicators represent a technical analysis tool employed by traders to identify potential trend reversals following downward price movements.
This signal contributes to an emerging pattern of short-term momentum indicators turning favorable for DOGE.
Examining the 30-minute timeframe, DOGE bounced from the $0.070 support level accompanied by elevated volume. Subsequently, the cryptocurrency has established a series of higher lows and higher highs, indicating short-term buyer dominance. The $0.075 level represents the immediate resistance area market participants are monitoring.
Weekly Timeframe Reveals Historically Significant Pattern
Technical analyst Javon Marks drew attention to Dogecoin’s weekly chart structure, observing the formation of higher lows — an architecture that materialized before earlier significant expansion cycles. Marks indicated the configuration appears recognizable and that this pattern has historically preceded substantial price movements.
The ascending support trendline supporting DOGE’s long-term framework remains unviolated. This preservation maintains the extended-term bullish scenario as viable, though validation would necessitate a decisive breach above overhead resistance.
Seasonal considerations for July are also entering trader calculations. Historical data shows DOGE appreciated 27.1% during July 2025, gained 17% in July 2023, and has advanced 4.27% in July 2026 to date. The cryptocurrency declined during July 2024 and 2021.
At present valuation levels, DOGE maintains a circulating supply of 170.62 billion tokens without an enforced maximum supply limitation.
Get 3 Free Stock Ebooks
Discover top-performing stocks in AI, Crypto, and Technology with expert analysis.
- Top 10 AI Stocks - Leading AI companies
- Top 10 Crypto Stocks - Blockchain leaders
- Top 10 Tech Stocks - Tech giants

