



Key Takeaways
- ETH hovers around $2,095–$2,110, failing to reclaim critical moving averages
- Smaller holders dumped 110,000 ETH over the past week, extending a multi-month selloff
- Spot Ethereum ETFs in the US saw approximately $216M in outflows for the second week running
- Coinbase Premium Index continues declining, signaling subdued demand from American traders
- Futures market activity shows increased open interest above 15M ETH as traders position for recovery
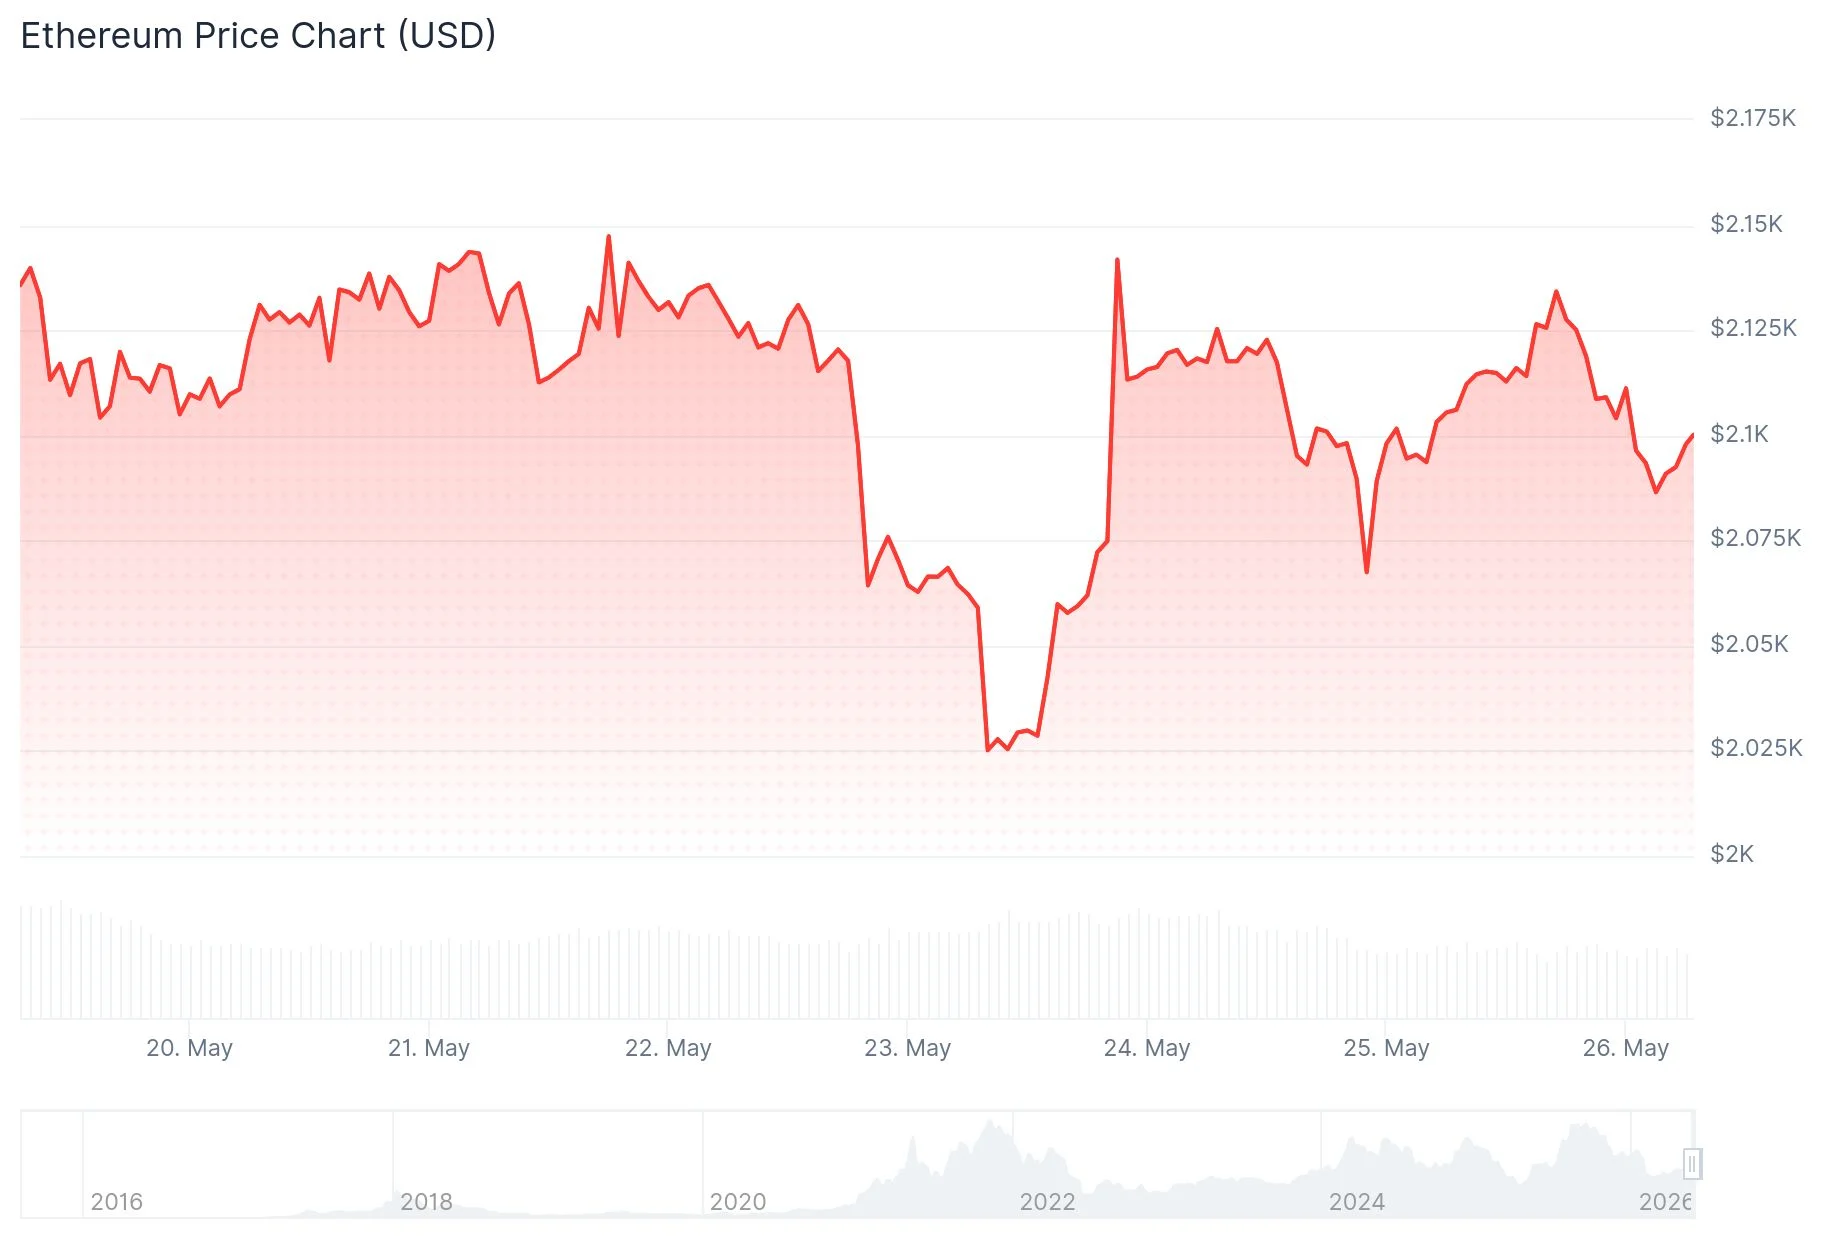
Ethereum is clinging to the $2,100 mark on Monday, posting modest daily gains of roughly 1% but unable to generate meaningful bullish momentum. The asset dipped beneath $2,110 and its 100-hour Simple Moving Average following an unsuccessful attempt to maintain ground above $2,120.
Addresses containing between 100 and 1,000 ETH liquidated 110,000 tokens during the previous seven days. This distribution trend has persisted since November, indicating sustained exit pressure from mid-tier holders looking to realize gains or cut losses.
Larger wallets holding 1,000 to 100,000 ETH demonstrated negligible activity last week. This marks a departure from the preceding week when these whales were actively distributing, potentially signaling that major holders have completed their selling cycles.
Market observer Ted Pillows highlighted the concerning price behavior via social media, cautioning that Ethereum’s inability to break back above $2,150 presents a bearish technical setup. “This is not a good sign and shows more weakness could be on the way for Ethereum,” he posted.
ETH remains trapped beneath the average onchain acquisition cost for both retail participants and whale cohorts, which clusters between $2,200 and $2,500. This zone is functioning as overhead resistance, with holders likely to sell as prices approach their entry points.

American Investor Interest Wanes
The Coinbase Premium Index extended its decline through last week, perpetuating a downtrend initiated in late April. This indicator measures the pricing differential between Coinbase and competing platforms, serving as a proxy for US institutional appetite. The deteriorating metric implies American capital is staying on the sidelines.

Spot Ethereum ETFs traded in the United States reinforced this narrative, recording approximately $216 million in net redemptions for a second straight week. These investment vehicles have now experienced ten consecutive days of withdrawals, based on SoSoValue tracking data.
Examining the daily chart, Ethereum remains positioned below its 20-day, 50-day, and 100-day exponential moving averages, which are bunched between $2,183 and $2,308. The Relative Strength Index reads near 39, reflecting tepid buying interest. While the Stochastic Oscillator is bouncing from oversold conditions, meaningful recovery faces obstacles with those moving averages forming a resistance cluster.
Critical Price Zones
Near-term resistance emerges at $2,110, followed by $2,120 and $2,150. Successfully clearing $2,220 would establish a pathway toward $2,250 or potentially $2,320.
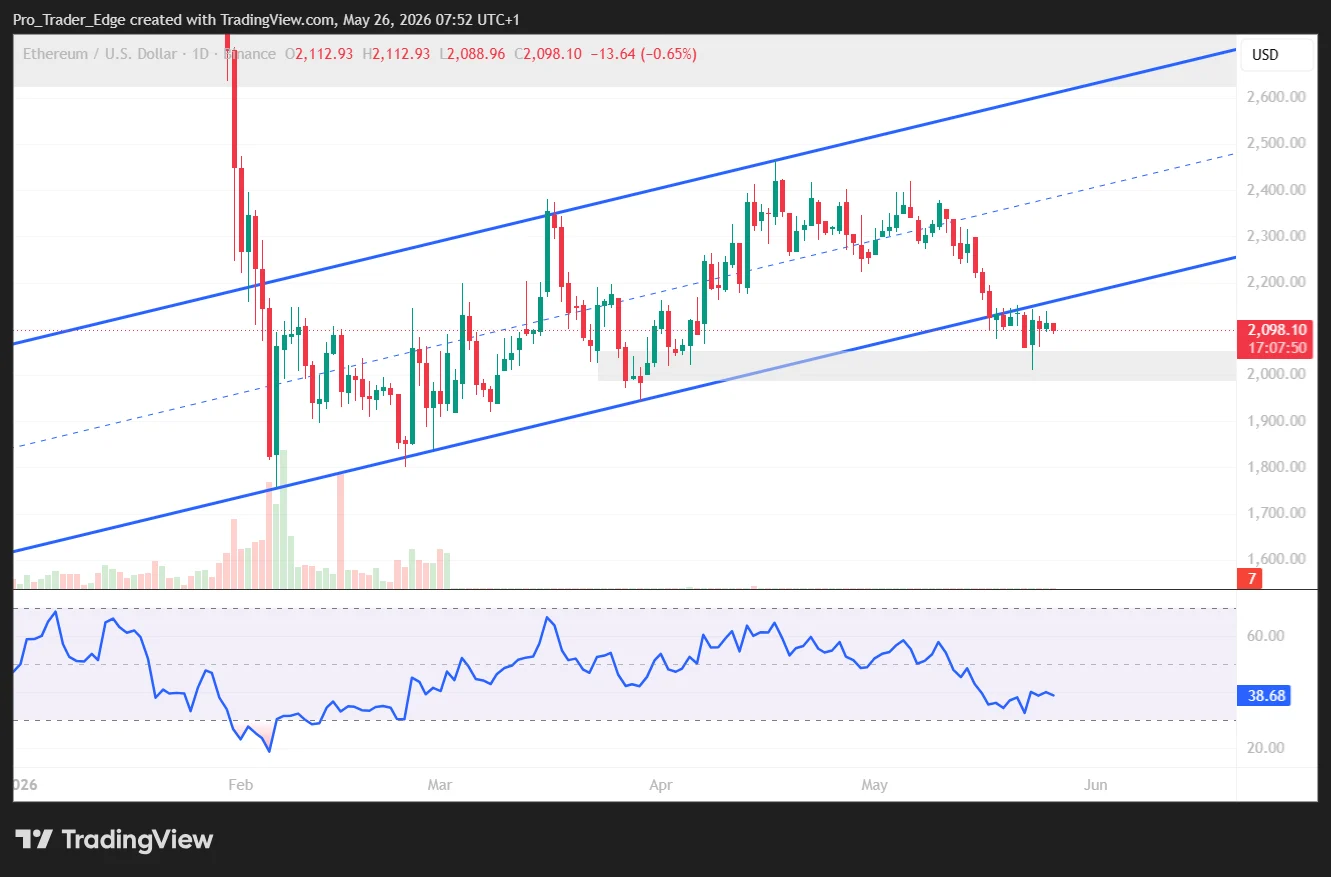
For support levels, initial defense stands at $2,075, with $2,060 below that. Breaking through these floors could drive ETH toward $2,020 and the psychological $2,000 threshold. Further deterioration would expose $1,940 as the next significant support zone.
Countering the bearish spot market conditions, ETH futures open interest surged past 15 million ETH while funding rates maintained positive territory, according to Coinglass metrics, indicating derivatives participants continue accumulating on price weakness.
Get 3 Free Stock Ebooks
Discover top-performing stocks in AI, Crypto, and Technology with expert analysis.
- Top 10 AI Stocks - Leading AI companies
- Top 10 Crypto Stocks - Blockchain leaders
- Top 10 Tech Stocks - Tech giants


