



Key Takeaways
- Ethereum is currently priced at $1,794, registering a 24-hour gain of 3.09% with market capitalization at $216.79B
- Crypto analyst Ted indicates that maintaining support above $1,750 could trigger a rally toward the $1,850–$1,900 zone
- Futures open interest climbed 3.63% to reach $24.65B, reflecting increased market participation
- Stephen Suttmeier, ex-Bank of America strategist, identifies a potential “tactical bottom” emerging above the $1,690 threshold
- Large holder distribution and $52M in ETF withdrawals present obstacles to continued upward momentum
Ethereum currently trades at $1,794, displaying indicators of possible upward movement despite facing multiple resistance factors. The current market data reveals the following picture.
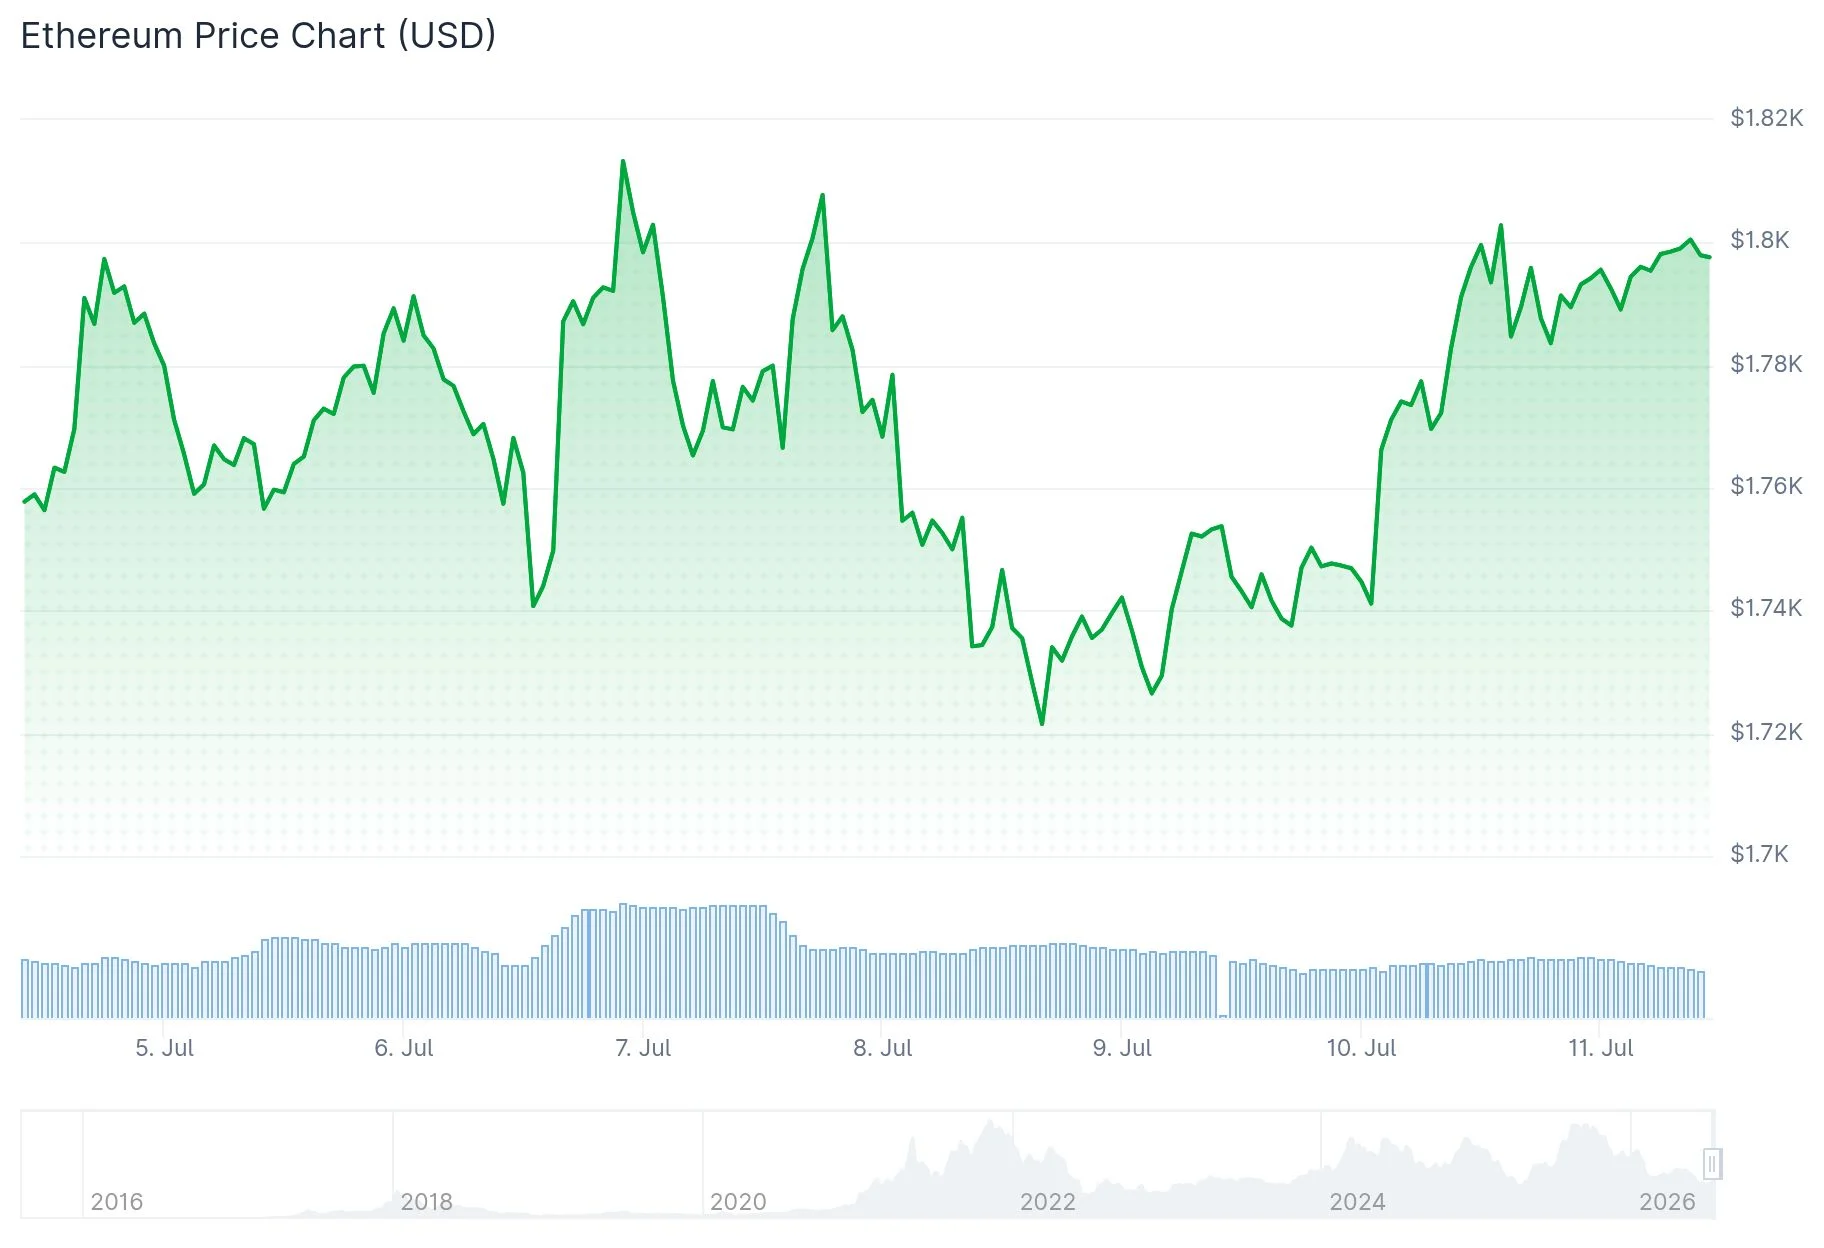
The second-largest cryptocurrency by market cap posted a 3.09% advance over the past day. Volume reached $17.08 billion in 24-hour trading activity, while market capitalization stands at $216.79 billion, per CoinMarketCap data.
Market analyst Ted observed that ETH’s ability to maintain the $1,750 support level represents a constructive technical development. According to his assessment, continued buying pressure in the spot market could propel prices into the $1,850–$1,900 territory.
Should ETH successfully breach this overhead resistance area, additional buying interest could materialize and reinforce the ongoing rebound. Conversely, a breakdown beneath $1,750 would undermine the constructive technical outlook.
Futures Markets and Blockchain Metrics
ETH futures open interest expanded 3.63% to $24.65 billion. The combination of increasing open interest concurrent with price appreciation typically indicates healthy market dynamics.

Derivatives trading volume declined 6.21% to $28.76 billion. This contraction suggests market participants are maintaining existing positions rather than executing new short-term trades.
The open interest-weighted funding rate registers at 0.0042%, remaining in positive territory. This indicates a predominance of long positions without evidence of dangerous leverage accumulation.
On-chain analyst Ali Charts highlighted on X that Ethereum’s MVRV ratio has fallen beneath 0.8, entering what he characterizes as “deep accumulation territory.” He emphasized that this threshold was previously touched three times—in December 2018, March 2020, and June 2022—with each instance preceding a price floor and subsequent reversal.
Expert Technical Perspectives
Stephen Suttmeier, previously Bank of America’s Head of Technical Strategy, suggested that ETH might be establishing a “tactical bottom.” His analysis indicates that sustained trading above the $1,690–$1,700 range reinforces this interpretation.
Suttmeier further noted that a convincing recapture of $1,800 and the 50-day moving average would create a pathway toward the 200-day MA situated near $2,200. This scenario would deliver approximately 25% gains from present price levels.
Fundstrat’s Tom Lee amplified Suttmeier’s technical framework, adding credibility to the optimistic structural assessment.
Nevertheless, selling pressure on exchanges has intensified since March. CryptoQuant documented a 6% spike in ETH deposits to exchanges recently, creating friction around the $1,800 level.
Large wallet holders continue their distribution pattern. Whale addresses have been reducing holdings throughout the recent price recovery.
Regarding exchange-traded products, a five-day streak of positive net flows reversed Thursday with a $52 million net withdrawal. This reversal coincided with escalating Iran-U.S. geopolitical tensions and volatility in the bond markets.
ETH is currently trading marginally beneath the $1,800 threshold that market analysts have pinpointed as the crucial near-term catalyst.
Get 3 Free Stock Ebooks
Discover top-performing stocks in AI, Crypto, and Technology with expert analysis.
- Top 10 AI Stocks - Leading AI companies
- Top 10 Crypto Stocks - Blockchain leaders
- Top 10 Tech Stocks - Tech giants


