
 Price Action: Critical $1,700 Support Zone Under Pressure")
Quick Overview
- Open interest in Ethereum futures has declined by approximately 2 million ETH since the end of May.
- Funding rates continue to fluctuate between positive and negative territory, indicating indecisive market sentiment.
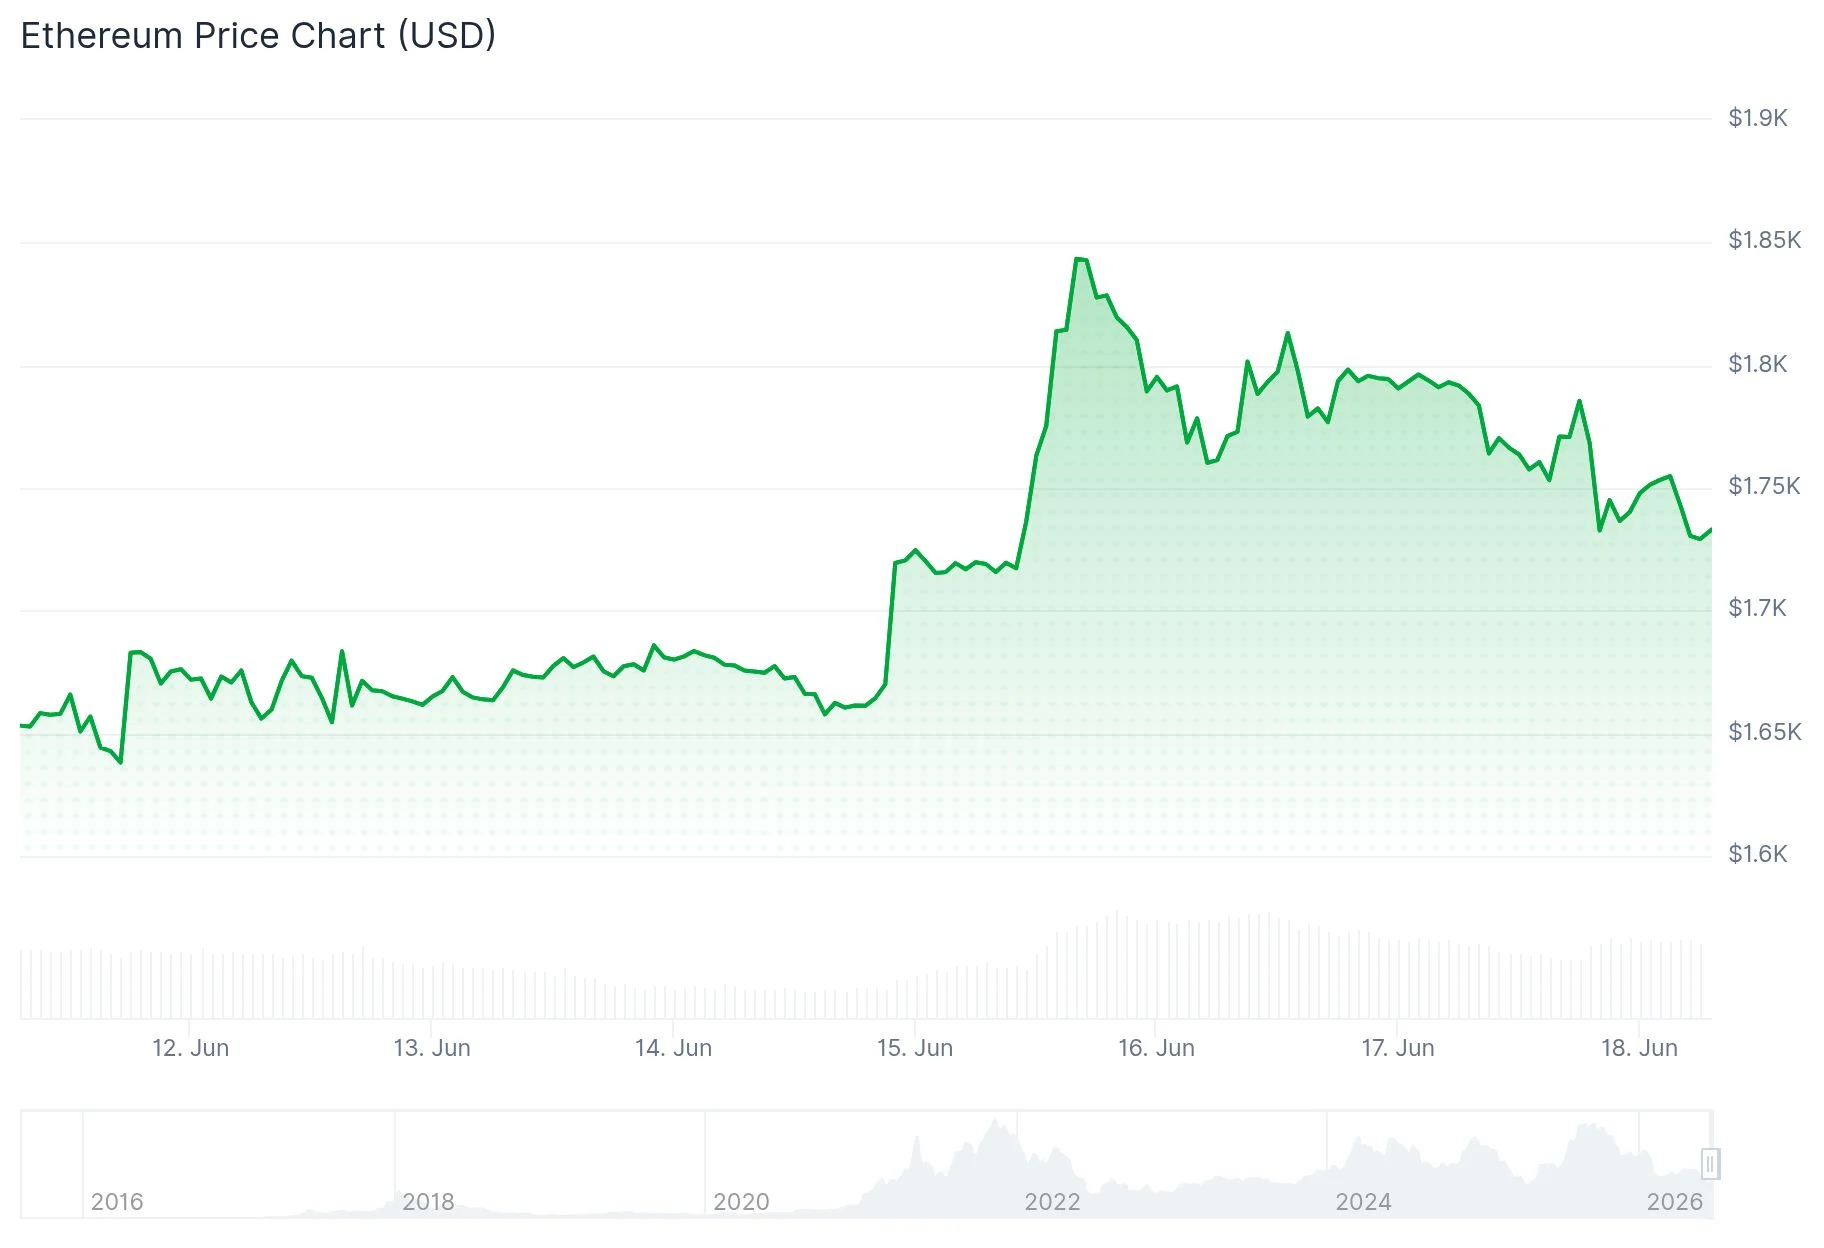
- ETH price action remains confined to a narrow range between $1,741 and $1,806, with the 20-day EMA around $1,794 providing overhead resistance.
- Spot ETF flows returned to positive territory with modest inflows of $9.6 million recorded on Tuesday.
- Market analyst Ted Pillows identifies the $1,700 to $1,750 range as the critical support zone that must hold.
Ethereum (ETH) is currently hovering around $1,740 amid subdued derivatives market activity following a recent market correction. Market data reveals persistent caution among traders after ETH briefly dipped below the $1,600 level earlier in June.
Open interest in Ethereum futures contracts dropped to 13.64 million ETH by Sunday, marking the lowest reading since early May. A modest rebound occurred following Monday’s price recovery above the $1,700 threshold.
The period since May 28 has witnessed approximately 2 million ETH in capital withdrawal from futures markets, signaling a risk-averse stance among leveraged market participants.
Funding rates have similarly displayed weakness, oscillating between negative and positive values throughout the past fourteen days.
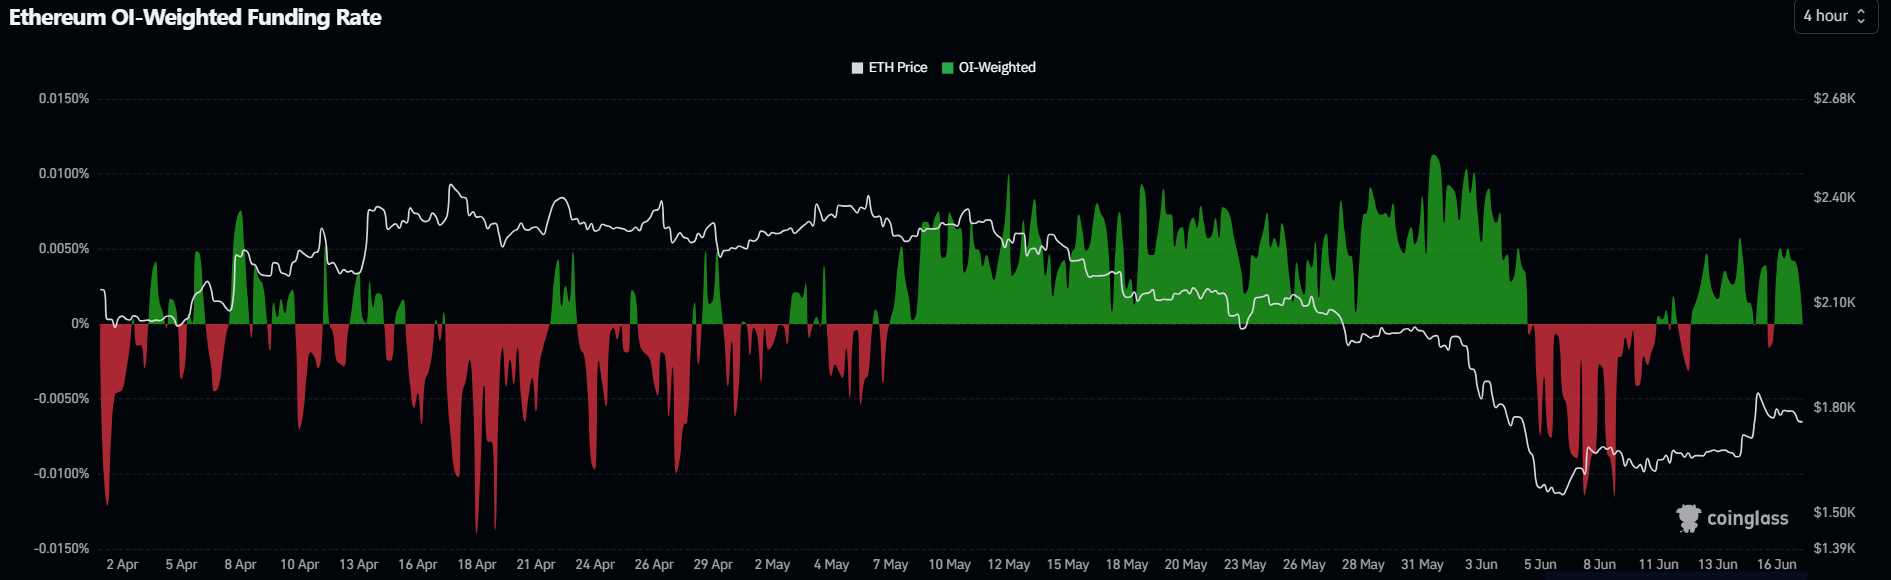
This fluctuation indicates a lack of directional conviction from either bullish or bearish traders. The pattern emerged following substantial long position liquidations that occurred during the late May and early June period.

Spot market activity shows exchange reserves experiencing slight declines over recent sessions. Meanwhile, US-based spot Ether ETFs recorded their second consecutive day of positive flows, attracting $9.6 million on Tuesday.
Overhead Resistance Limits Upside Potential
Despite these marginal improvements, the overall data landscape continues to reflect hesitant market conviction. Neither retail nor institutional participants have demonstrated a decisive directional bias.
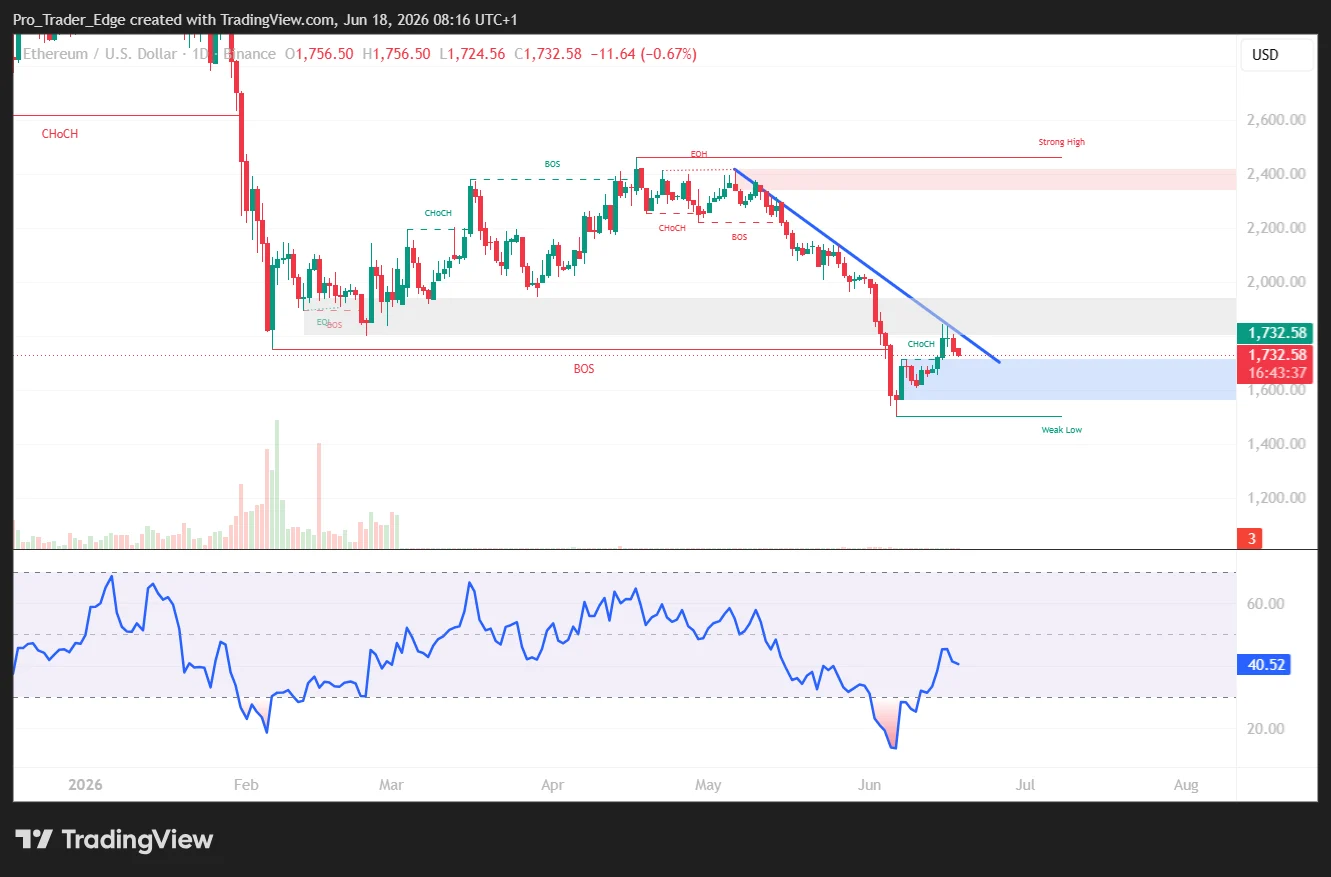
Technical analysis of the daily timeframe reveals ETH trading beneath its 20-day, 50-day, and 100-day exponential moving averages. These technical indicators form a resistance cluster spanning approximately $1,794 to $2,109.
The nearest resistance barrier sits at the 20-day EMA around $1,794. Beyond that level, market participants are monitoring the horizontal resistance zone at $1,806.
Should ETH successfully breach these levels, subsequent resistance targets include $1,909, $1,955, and $2,019. The 100-day EMA positioned near $2,108 represents another significant barrier that could cap upward momentum.
Critical Support Zone Draws Market Attention
Looking at downside risk, the first support level is positioned near $1,741. Should this level fail, subsequent support targets include $1,524, $1,405, and ultimately $1,156.
Technical commentary has emphasized the importance of the $1,700 to $1,750 region. A decisive breakdown below $1,700 could trigger accelerated selling pressure toward levels under $1,500.
Analyst Ted Pillows noted that Ethereum has slipped beneath the $1,800 mark, emphasizing that the $1,700 to $1,750 support band must remain intact to enable another upward move. Failure to maintain this zone could result in a decline toward sub-$1,500 territory.
Market observers suggest that Federal Reserve policy signals and subdued trading volumes may continue to influence ETH price behavior heading into the June month-end. The current technical picture is straightforward: Ethereum remains range-bound with resistance concentrated between $1,794 and $1,806, while support attention centers on $1,741 and the broader $1,700 to $1,750 zone.
Get 3 Free Stock Ebooks
Discover top-performing stocks in AI, Crypto, and Technology with expert analysis.
- Top 10 AI Stocks - Leading AI companies
- Top 10 Crypto Stocks - Blockchain leaders
- Top 10 Tech Stocks - Tech giants

