
 Price Slides Below Critical Threshold—Analyst Eyes $1,580 Target")
Key Takeaways
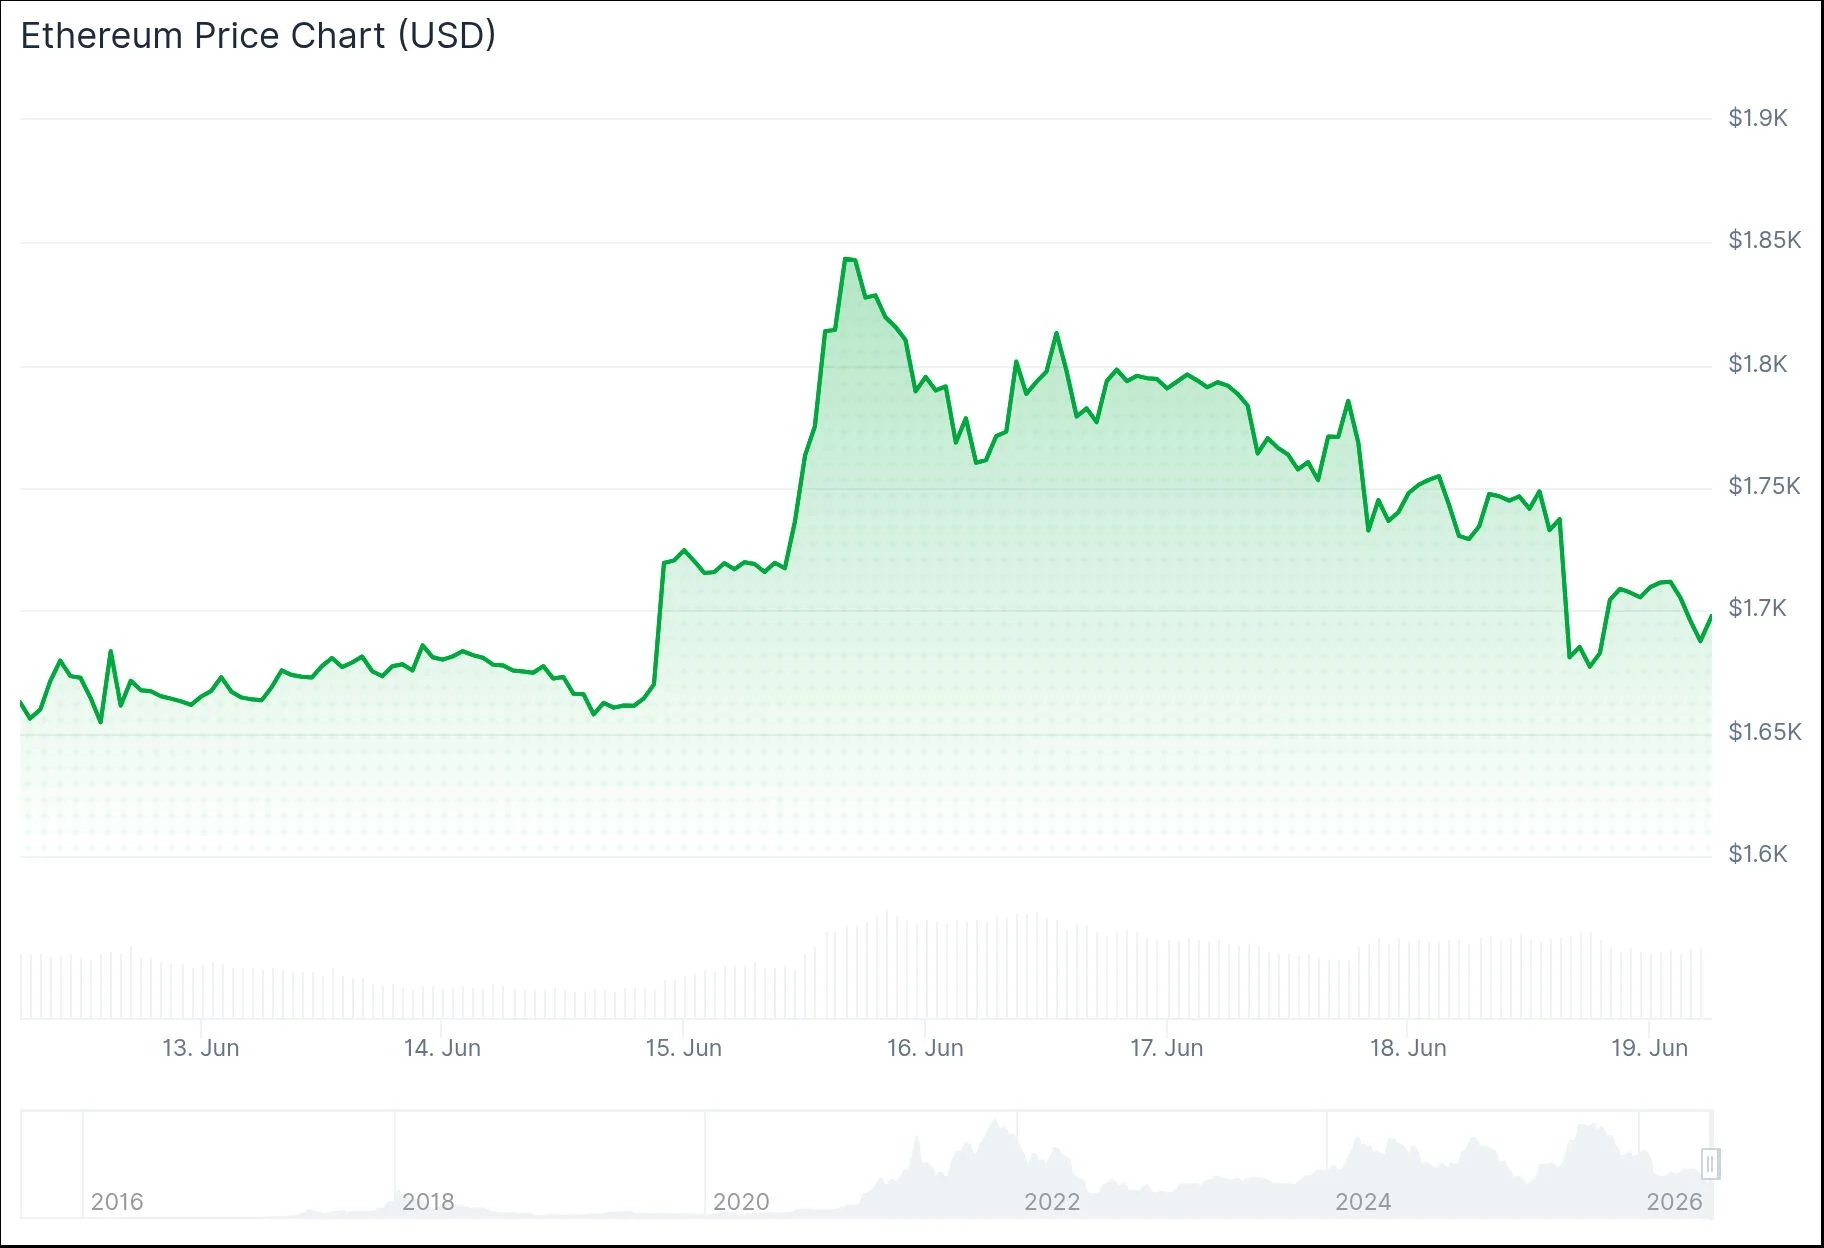
- Ethereum currently trades near $1,682, sliding approximately 5% intraday after violating a crucial ascending trendline.
- On-chain metrics showed exceptional growth in Q1 2026, registering 13.2 million monthly active users and over 200.4 million transactions.
- Tokenized commodity assets on the Ethereum network surged 60% quarter-on-quarter, predominantly driven by Gold tokenization.
- The derivatives market has cooled significantly, with options open interest declining from $8.5 billion to just $5.5 billion.
- Price action remains constrained between the $1,500 floor and $1,920 ceiling as volatility continues to contract.
Ethereum has retreated to approximately $1,682 following a sharp nearly 5% decline within 24 hours. The digital asset pierced a significant upward-sloping trendline, bringing the next critical support zone around $1,500 into sharper focus.
The daily timeframe reveals another period of compressed volatility following June’s aggressive selloff. This consolidation pattern mirrors the setup that preceded the last substantial downward movement.
Market analyst Ali Charts shared insights on X platform: “Ethereum $ETH is breaking down from its channel and is now trading below the 200-hour SMA. I’m expecting a move toward $1,580.” This projection corresponds with the prevailing bearish technical framework, where ETH remains trapped beneath the $1,750 resistance zone following a temporary rebound from the $1,500 base.
The second-largest cryptocurrency has surrendered multiple significant support zones in recent trading sessions. A critical ascending trendline and the $2,150 threshold both failed in mid-May, followed by a breakdown through $1,920 before demand materialized around $1,500.
From that bottom, ETH managed to rally back toward the lower boundary of a downward-sloping channel near $1,750. This price level has now transformed from support into resistance.

Options Market and Fund Flows Indicate Subdued Sentiment
Ethereum’s options open interest across major exchanges has contracted to approximately $5.5 billion, substantially below the $8.5 billion peaks observed during January and March. Perpetual swap funding rates have simultaneously compressed toward zero, indicating balanced positioning between long and short traders.

Reduced open interest combined with neutral funding dynamics indicates diminished leverage across the marketplace. When a significant catalyst emerges, price action could experience pronounced movement with minimal friction in either direction.
Spot Ethereum ETF activity has likewise stabilized recently. Following consecutive months of persistent redemptions, June witnessed several days registering modest net inflows. While the absolute volumes remain limited, this rotation from outflows to tentative accumulation marks a notable shift from previous trends.
Network Fundamentals Reach All-Time Highs Amid Price Weakness
Notwithstanding the challenging price environment, Ethereum’s fundamental network metrics delivered impressive performance during Q1 2026. Monthly active addresses averaged an unprecedented 13.2 million, representing a 53.5% increase from the previous quarter. Total transactions climbed to 200.4 million, marking a 38% quarterly expansion.
Network throughput established a new benchmark at 25.78 transactions per second. Transaction fees, however, decreased 47.9% quarter-on-quarter in the aftermath of December’s Fusaka upgrade, which significantly enhanced data availability.
Tokenized commodity markets built on Ethereum expanded 60% quarter-over-quarter to reach $4.7 billion in value, with Gold representing nearly the entire growth driver. Ethereum commands an 84% market share of tokenized commodities among the five largest blockchain networks.
ETH’s fully diluted valuation contracted to $290 billion in Q1, reflecting a 30.3% quarterly decline. The daily Relative Strength Index currently hovers near 38, suggesting weakening downside momentum that may be reaching exhaustion levels.
Get 3 Free Stock Ebooks
Discover top-performing stocks in AI, Crypto, and Technology with expert analysis.
- Top 10 AI Stocks - Leading AI companies
- Top 10 Crypto Stocks - Blockchain leaders
- Top 10 Tech Stocks - Tech giants

