


Key Highlights
- Ethereum’s price reached $2,436 on August 29, declining 2.33% within 24 hours
- Spot Ethereum ETFs in the U.S. achieved 10 consecutive days of positive inflows amounting to $1.52 billion
- ETHA from BlackRock dominated with $1.02 billion across nine sessions, capturing approximately 72% of total flows
- September 15 marks the Senate cloture vote date for the CLARITY Act
- Critical support for ETH remains at $2,350, with overhead resistance positioned at $2,500
Ethereum’s value declined to $2,436 on August 29 amid a broader cryptocurrency market downturn that saw values drop 1.71% in a 24-hour period, bringing the aggregate crypto market capitalization down to $2.62 trillion. Bitcoin was hovering under $78,000 while XRP maintained levels near $1.38.
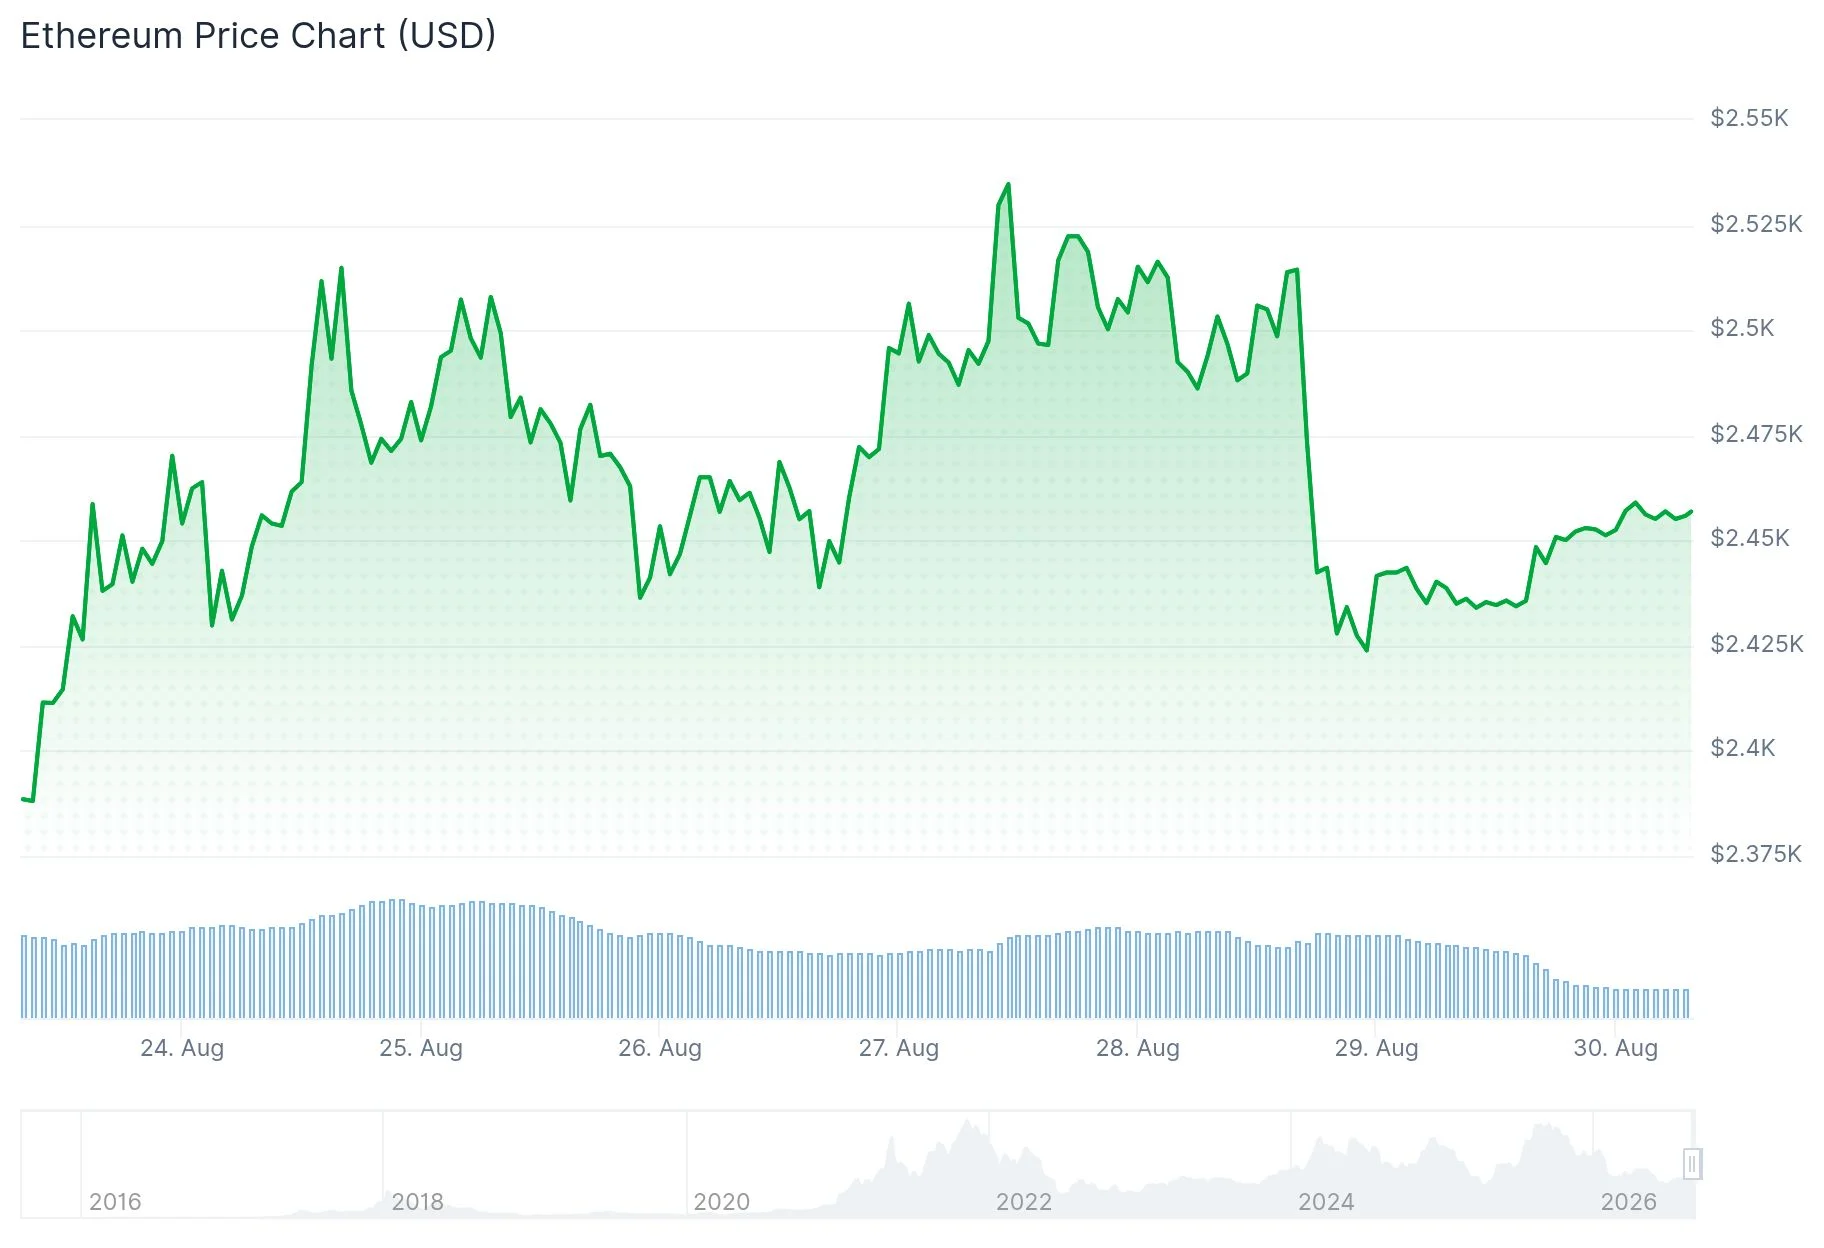
While the recent price action shows weakness, ETH has experienced a substantial recovery from approximately $1,900 levels observed in mid-August. The digital asset surpassed $2,200 and made several attempts to break through $2,500 resistance before encountering selling pressure.
Spot Ethereum ETFs in the United States registered $102.18 million in net positive flows on August 28, extending their winning streak to 10 consecutive trading sessions. The cumulative inflows during this remarkable run totaled roughly $1.52 billion.
During the trading week concluding around August 21, Ethereum ETF products attracted approximately $697 million in capital — representing the most robust weekly performance in roughly 10 months and establishing a 2026 peak at that point, according to data from SoSoValue.
BlackRock’s ETHA Commands Market Share
ETHA, BlackRock’s Ethereum ETF product, absorbed approximately $1.02 billion throughout nine consecutive trading days spanning August 17 through August 27, representing roughly 72% of aggregate U.S. spot Ethereum ETF inflows during that timeframe.

The peak single-day performance occurred on August 27, registering $225.8 million in capital inflows — the strongest daily reading since October 28, 2025. ETHA’s total net inflows since inception in July 2024 have climbed to approximately $12.74 billion, with assets under management hovering around $8.46 billion.
The roughly 385,633 ETH tokens acquired during the eight-day period suggests an average acquisition price ranging between $2,490 and $2,550. This represents a significant discount compared to ETHA’s historical average cost basis of approximately $3,060.
It’s important to note that spot ETF purchases reflect client demand rather than proprietary trading by BlackRock. When market participants purchase ETHA shares, the fund procures Ethereum through its custodian Coinbase Prime to maintain appropriate backing.
FETH from Fidelity stood alone with negative flows on August 28, experiencing $24.26 million in redemptions. Products from Grayscale, Bitwise, VanEck, and Franklin showed zero net flow activity for that trading day.
Technical Outlook for ETH
The Relative Strength Index for ETH registered 44.09, indicating diminished momentum without entering oversold conditions. The MACD indicator measured 0.65, positioned beneath its signal line at 12.62, while the histogram declined to -11.97.
Market analyst Ash Crypto highlighted on X that the ETH/BTC trading pair is developing a triangle consolidation pattern with a narrowing price range. According to his analysis, a successful breakout above the descending trendline could propel ETH toward $2,800, whereas a failed attempt might result in a pullback to the $2,000–$2,200 zone.
Trading analyst Michaël van de Poppe (@CryptoMichNL) shared his perspective that should ETH validate a genuine breakout pattern, he anticipates the subsequent rally phase could target $3,200, with potential extension toward $3,500.
The CLARITY Act legislation, having already cleared the House of Representatives, now awaits a crucial Senate cloture vote scheduled for September 15, which necessitates at least 60 affirmative votes to proceed toward final passage.
Get 3 Free Stock Ebooks
Discover top-performing stocks in AI, Crypto, and Technology with expert analysis.
- Top 10 AI Stocks - Leading AI companies
- Top 10 Crypto Stocks - Blockchain leaders
- Top 10 Tech Stocks - Tech giants


