
 Surges Past $1,700 as Historic Monthly Buy Signal Emerges")
Key Highlights
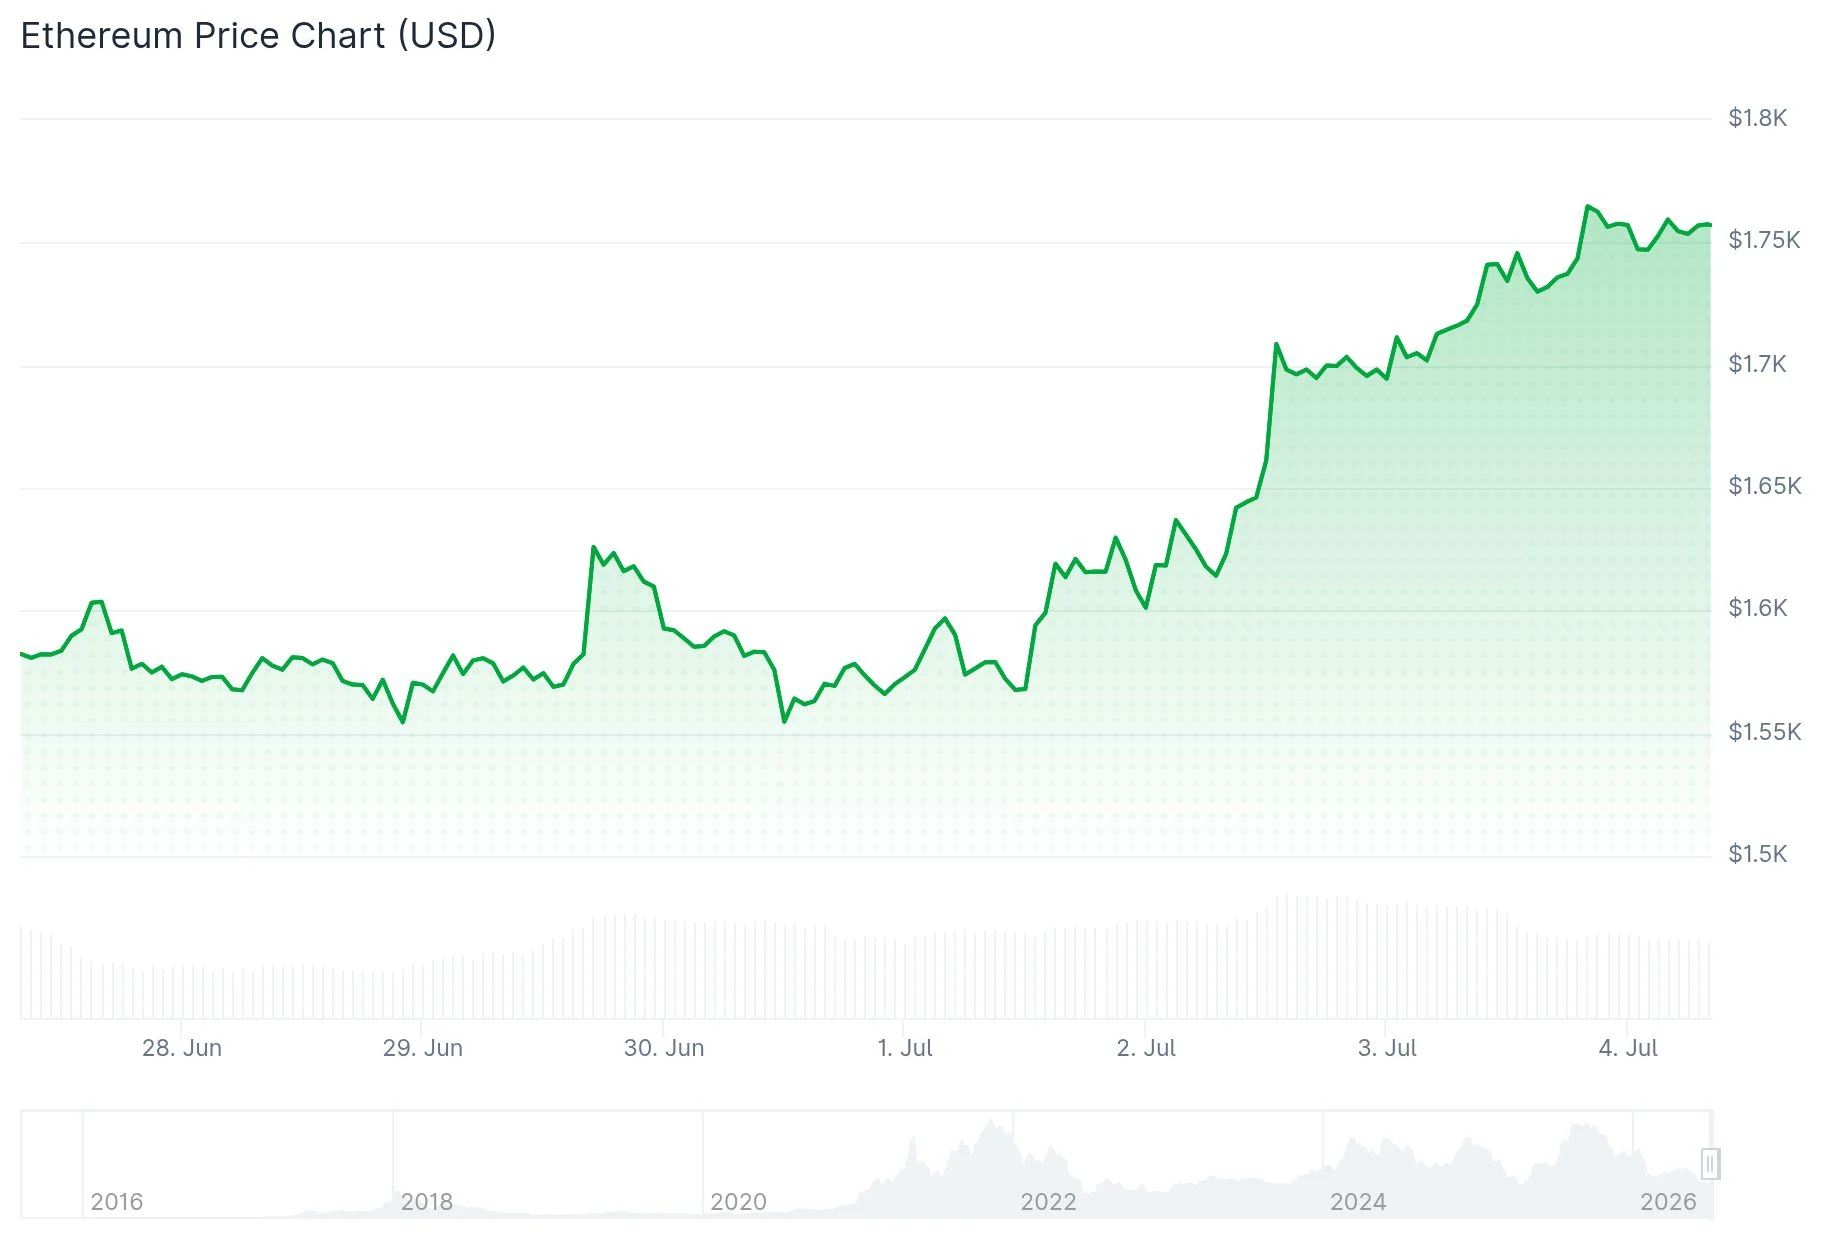
- ETH price reached approximately $1,715 on July 3, marking a 24-hour gain exceeding 6%
- Historic monthly TD Sequential buy indicator activated, previously appearing before significant price surges in 2022 and 2025
- Spot Ethereum ETFs in the United States registered $29.08 million in net capital inflows on July 2, with BlackRock’s ETHA dominating flows
- Market analyst Daan Crypto Trades identified $1,750 as critical resistance, describing it as a pivotal test for breaking the prevailing downward trend
- Ethereum withdrawals from Binance reached three-year peak levels, despite positive exchange netflow indicating continued selling pressure
Ethereum pushed beyond the $1,700 threshold on July 3, hovering around $1,715 following a 24-hour surge exceeding 6%. This price action returned ETH to territory closely monitored by market participants after sustained periods of downward momentum.
The upward movement coincided with renewed capital flows into U.S. spot Ethereum exchange-traded funds. Data from SoSoValue indicates that these ETFs captured $29.08 million in aggregate net inflows on July 2. BlackRock’s ETHA product dominated with $29.74 million in contributions, while Grayscale’s ETHE experienced withdrawals totaling $2.75 million.
Market commentator Daan Crypto Trades shared his perspective on the price action via social platforms. He observed ETH’s 10% weekly gain and highlighted the retest of February’s bottom near $1,750. He characterized this zone as essential territory to reclaim, stating it would “signal some strength.” He emphasized that this same region validated a structural breakdown in 2025, lending it historical significance. He maintained a neutral stance while monitoring how price responds to resistance at session close.
A monthly TD Sequential buy signal materialized for Ethereum — an infrequent technical development. Market analyst Ali Charts suggested the indicator reflects exhaustion among sellers on extended timeframes. Historical monthly buy signals preceded substantial rallies of 235% in 2022 and 182% in 2025. While the indicator doesn’t validate a new bullish cycle, it has captured attention among technical analysts.
Technical Analysis Overview
The MACD histogram registers positive at 19.33, with the MACD line ascending above its signal counterpart. Nevertheless, both indicators remain beneath the zero threshold, indicating the trend hasn’t completely inverted. The RSI climbed to approximately 51.85, rising above its moving average of 38.12 and surpassing the neutral 50 benchmark.

Ethereum bounced from a double-bottom formation near $1,565. Immediate resistance appears at $1,800, with additional barriers at $2,000. A concentration of liquidity around $1,740–$1,750 sits just above current trading levels, potentially attracting price movement in the near term.
Market commentator Crypto Patel highlighted that ETH recently completed its first-ever sequence of three consecutive quarterly declines since its inception — an unprecedented occurrence in Ethereum’s trading history.
Derivatives and Blockchain Metrics
Open interest expanded 10.64% to reach $24.54 billion, while ETH trading volume increased 14.48% to $44.74 billion. Funding rates jumped 113.86%, demonstrating substantial expansion in leveraged long positions throughout the rally.
CryptoQuant analyst Darkfost documented that Binance ETH withdrawal transactions achieved their highest count in three years, exceeding 166,000 within a single 24-hour period. Simultaneously, analyst PelinayPA observed that Binance ETH exchange netflow maintained a positive reading at +12,938 ETH, indicating more tokens entered the platform than departed.
Institutional participation persisted. BitMine maintains holdings surpassing 5.7 million ETH following an accumulation of 27,084 ETH. SharpLink acquired an additional 10,000 ETH valued at $16.1 million during the recent price decline.
Get 3 Free Stock Ebooks
Discover top-performing stocks in AI, Crypto, and Technology with expert analysis.
- Top 10 AI Stocks - Leading AI companies
- Top 10 Crypto Stocks - Blockchain leaders
- Top 10 Tech Stocks - Tech giants

