
 Slides 22% From Peak: Is Now the Time to Buy the Dip?")
Key Takeaways
- Hyperliquid’s HYPE token has declined 22% from its peak of $76.9, now hovering near $66
- Critical support zone between $50 and $54 coincides with the 50-day EMA, drawing significant attention
- Open interest has contracted from $2.2 billion down to $1.73 billion, indicating waning trader engagement
- While spot selling momentum has slowed, spot CVD remains in deeply negative territory at -$95 million
- Crypto analyst Altcoin Sherpa identifies the $55–$64 band as an attractive accumulation range, targeting $100
Hyperliquid’s native token, HYPE, has experienced a notable 22% retracement from its all-time high of $76.9 recorded just last week. The digital asset currently changes hands around $66 as market participants evaluate whether the bullish momentum that emerged in January can maintain its trajectory.
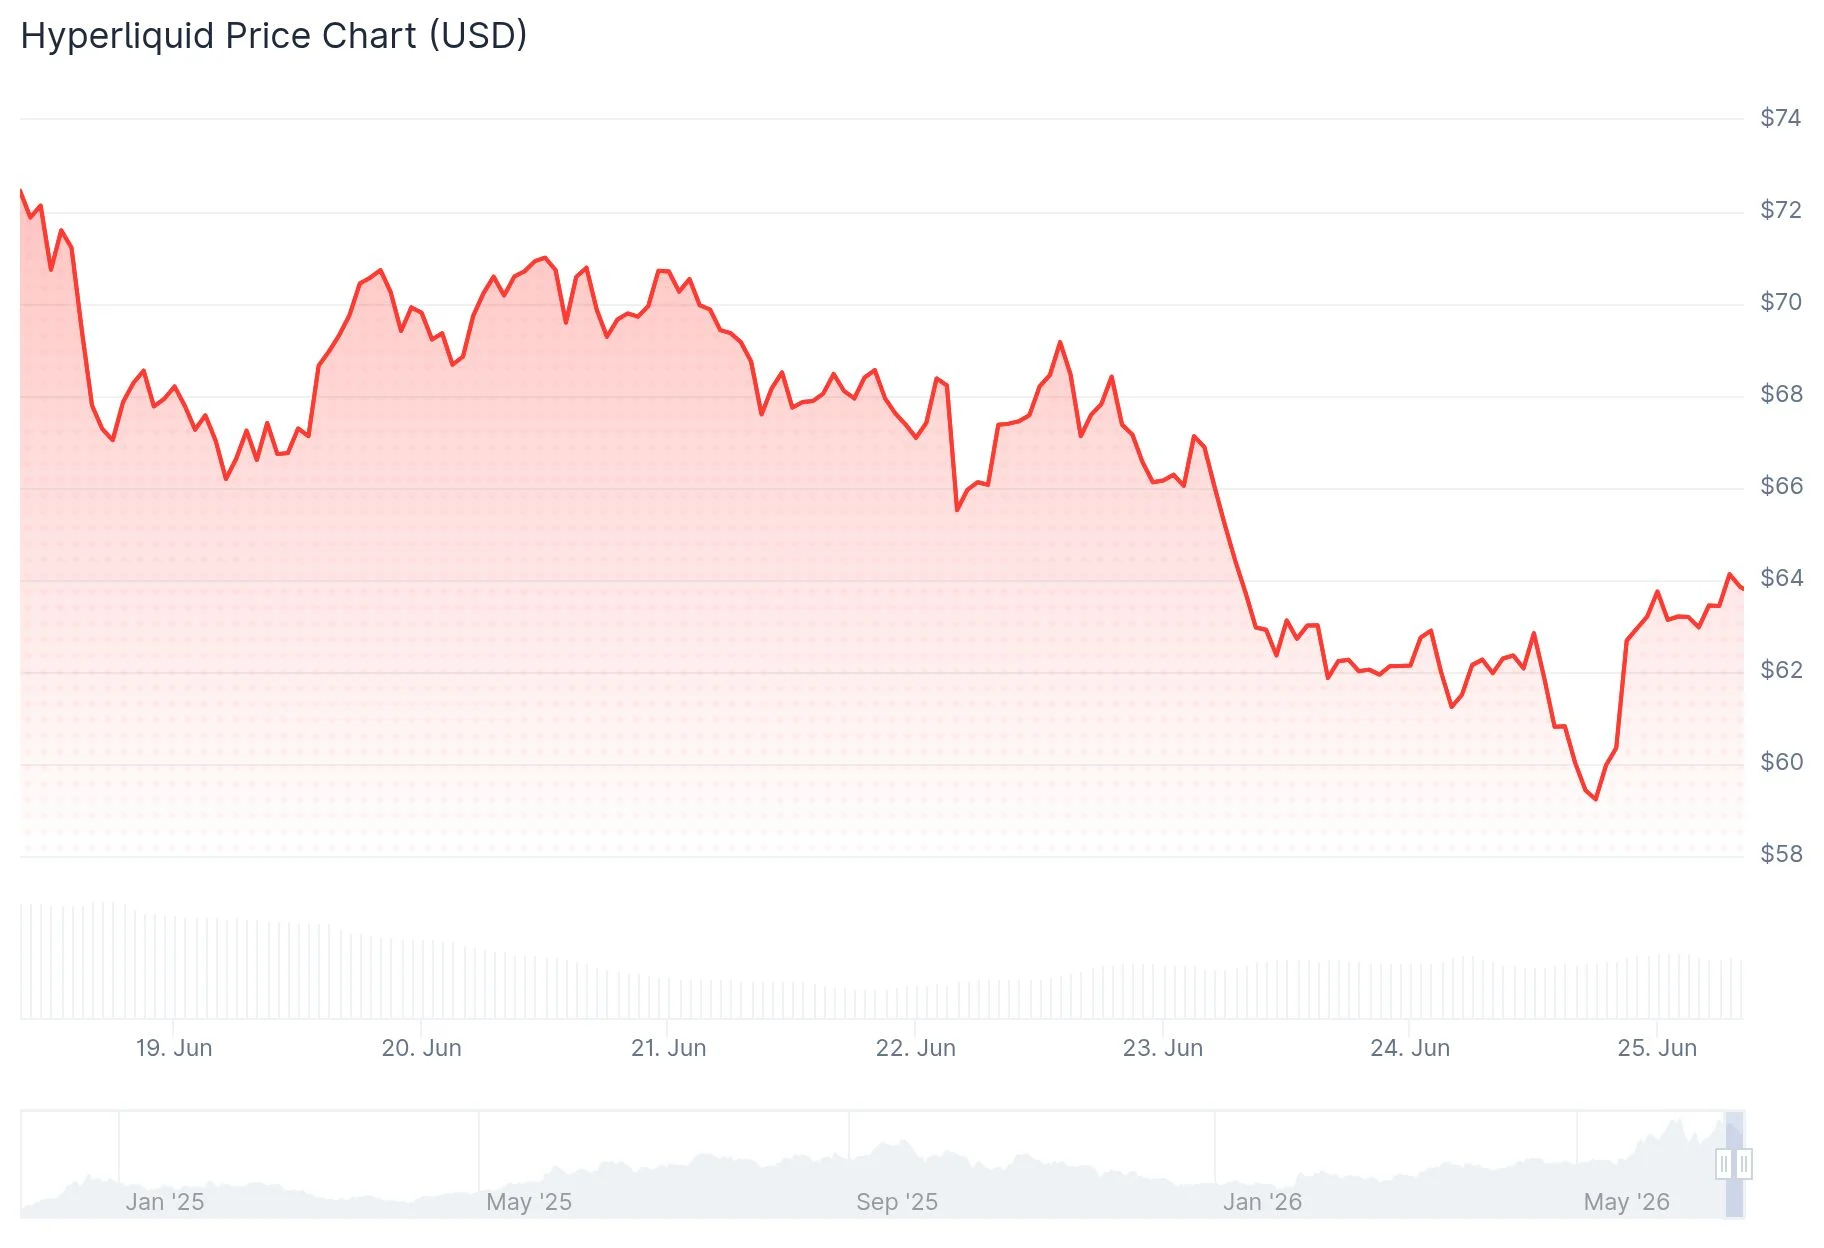
The correction materialized after the token met resistance near its historic peak of $76. Mid-week selling pressure pushed HYPE beneath the $60 threshold before finding equilibrium. The 50-day exponential moving average, which has provided consistent support during the March rally, is currently being tested again.
Futures market indicators continue to reflect optimistic sentiment. According to CoinGlass data, the long-to-short ratio stands at 1.03, accompanied by positive funding rates of 0.0042%. This configuration indicates that long position holders are compensating short sellers, traditionally interpreted as a bullish market signal.
Spot Market Pressure Shows Signs of Easing
Selling activity in the spot market has moderated compared to early June intensity. The aggregated spot cumulative volume delta (CVD) has recovered from recent nadirs, although it continues to register deeply negative at approximately -$95 million. During the initial descent from $76 in early June, spot selling climaxed at $110 million.
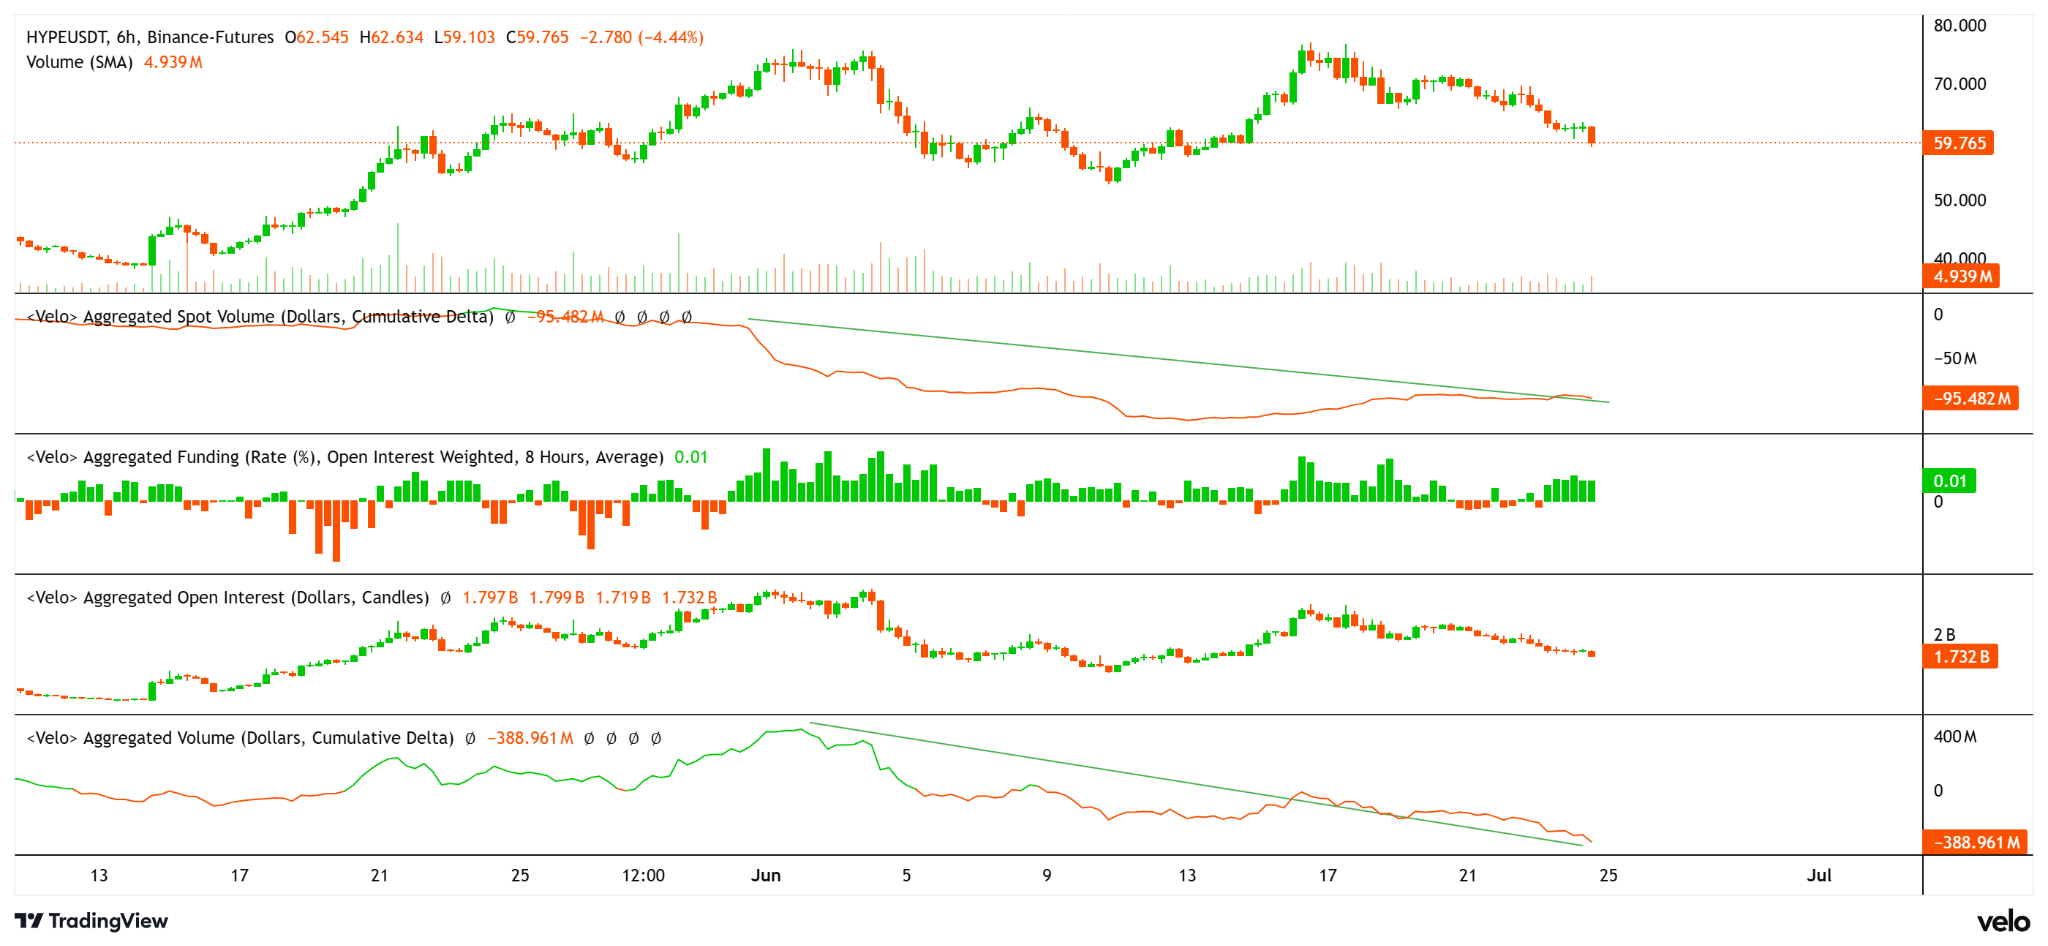
Derivatives markets paint a more conservative picture. Open interest has contracted from $2.2 billion to $1.73 billion. The derivatives CVD currently hovers near -$389 million. This data suggests traders are reducing their exposure rather than establishing fresh positions.

Social dominance metrics for HYPE have trended downward since June 17, currently registering 0.175% per Santiment analytics. Retail trader participation has increased following the record highs, a development some market observers interpret as a potential cautionary indicator for short-term price action.
Spot ETF flows have remained subdued throughout the week, with SoSoValue tracking minimal institutional involvement.
Critical $50–$54 Support Range Under Market Scrutiny
The most significant support level lies between $50 and $54. This range corresponds with the ascending 50-day EMA and an unfilled daily fair-value gap. A daily close beneath $53 would represent the first bearish technical formation on the daily timeframe in 2025.
Should that level fail, the 100-day EMA positioned at $51.57 becomes the subsequent target, followed by $49. More substantial support exists around the $38 level.
Cryptocurrency analyst Altcoin Sherpa offered his perspective on the current market structure: “HYPE, I think anywhere in the 55–64 area is a pretty good place to accumulate this one. I think it goes to $100 later this year personally and is still the best altcoin…but it’s going to also depend a lot on bitcoin IMO.”
Regarding upside potential, a daily close exceeding $74.60 would clear the path toward establishing fresh all-time highs. The 50-day EMA currently resides at $58.94, the 100-day at $51.57, and the 200-day at $44.68—all positioned below current price action and suggesting the fundamental uptrend remains undisturbed.
The Relative Strength Index reads approximately 53 on the daily timeframe, while the MACD displays mild negative divergence, indicating momentum has moderated without transitioning to outright bearish territory.
Get 3 Free Stock Ebooks
Discover top-performing stocks in AI, Crypto, and Technology with expert analysis.
- Top 10 AI Stocks - Leading AI companies
- Top 10 Crypto Stocks - Blockchain leaders
- Top 10 Tech Stocks - Tech giants

