
 Dips Under $70 Despite ETF Momentum and Booming RWA Ecosystem")
Key Takeaways
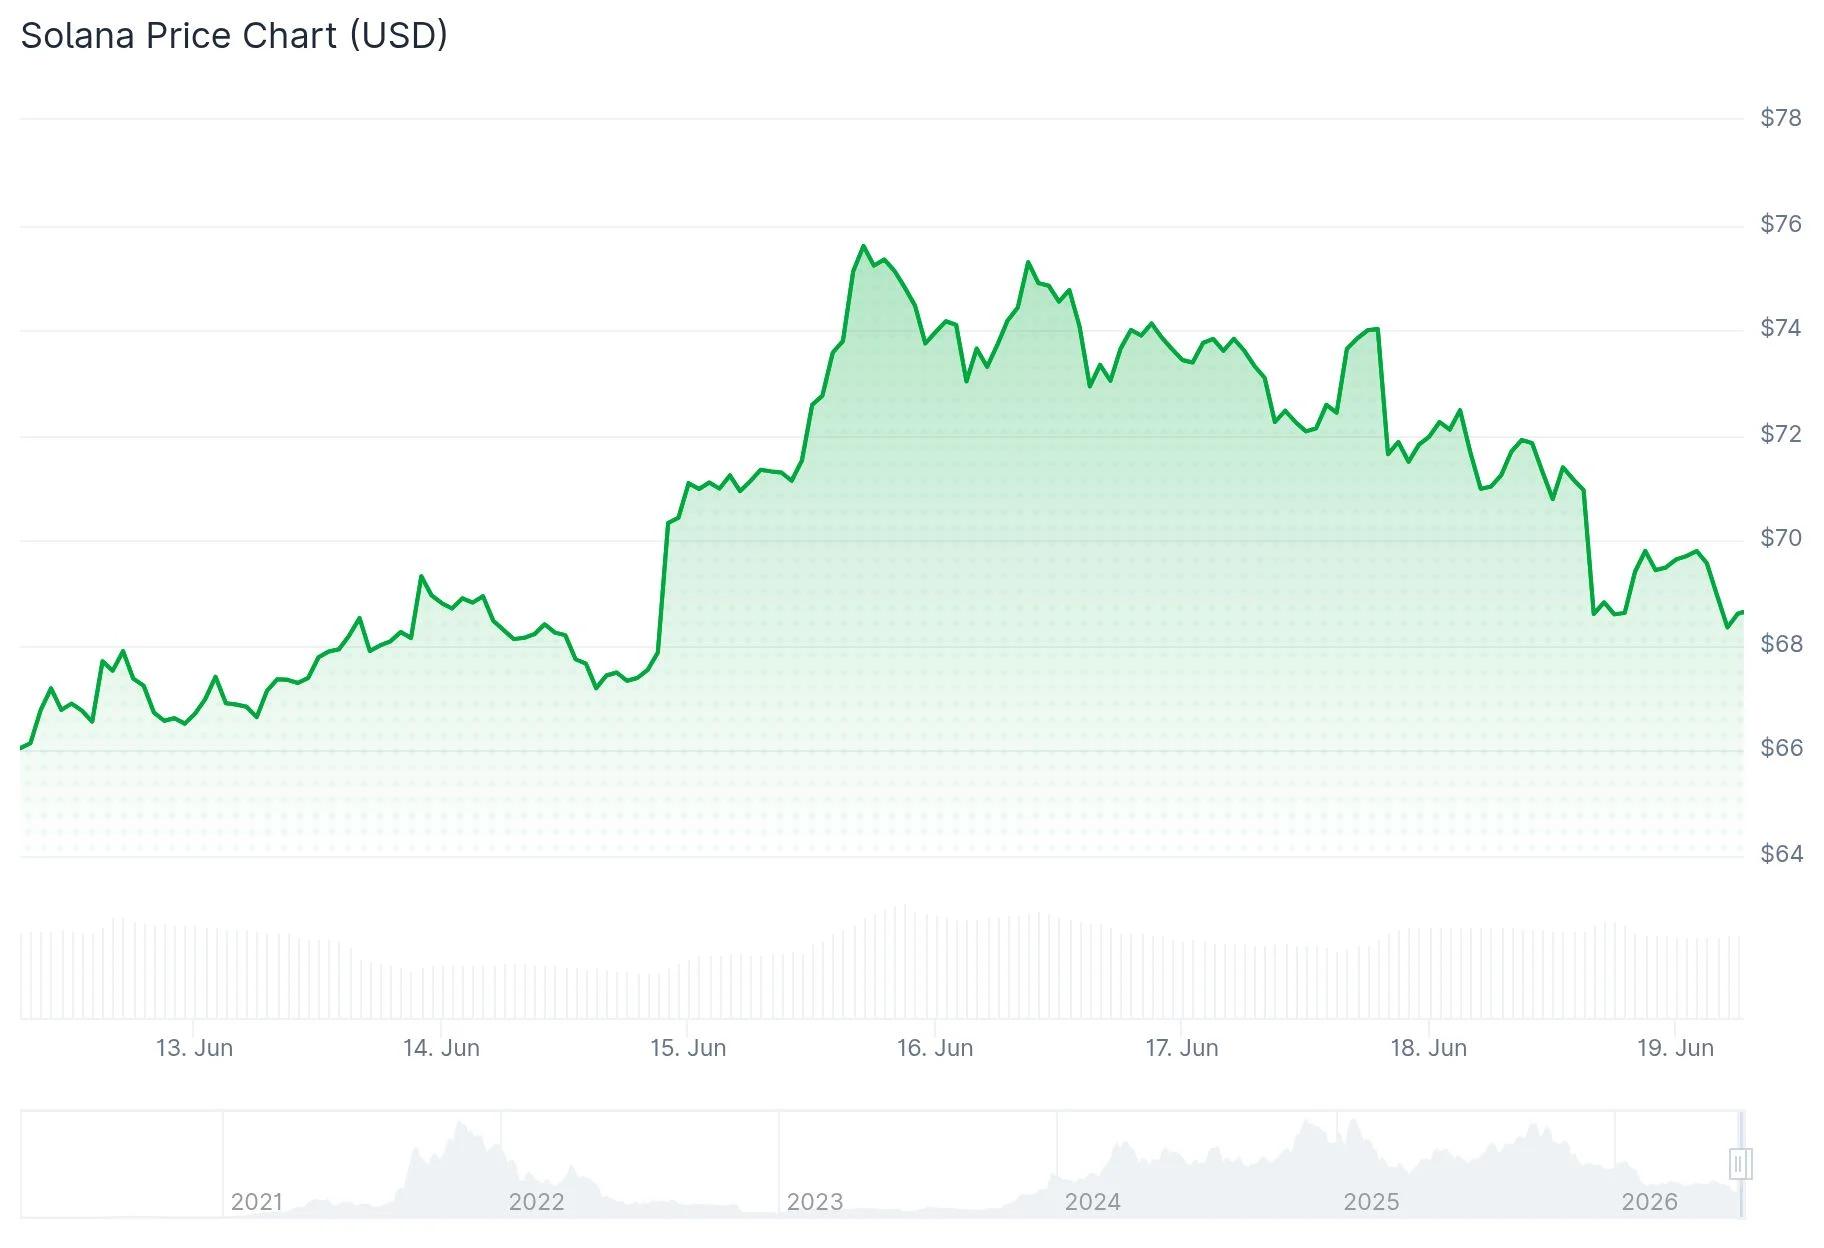
- Solana declined more than 6% from its June 15 peak of $75.60, slipping beneath $70
- Morgan Stanley submitted an updated S-1 filing to the SEC for its Solana ETF (MSOL)
- Weekly ETF inflows totaled $7.11 million even as prices retreated
- Solana leads all blockchains in tokenized Real-World Asset holders with over 285,000
- Critical support zone at $70; breakdown risks testing June’s $62 lows
Solana experienced a sharp reversal from its recent high of $75.60, touching an intraday bottom of $70.70 on June 18 before finding support around $71. This pullback came after a robust rally exceeding 20% from early June’s lows near $62.
The downturn intensified following the Federal Reserve’s decision to maintain interest rates within the 3.50%–3.75% range, coupled with cautionary signals about persistent inflation pressures. Central bank officials indicated potential additional tightening measures in 2026, prompting market participants to reduce exposure to volatile crypto assets like SOL.
Bitcoin simultaneously retreated toward the $64,000 level in response to the Fed’s statement. Many alternative cryptocurrencies experienced more pronounced declines than Bitcoin during this timeframe.
Crypto market analyst Ash Crypto observed that SOL’s monthly chart indicates the most oversold conditions in its trading history. He further emphasized Solana’s achievement of a new daily record for tokenized stock trading volume in cryptocurrency markets, surpassing $140 million in spot trading — with 97% occurring on Solana, outperforming all competing blockchains combined.
Despite downward price action, institutional appetite for Solana remains robust. SOL-focused exchange-traded funds attracted $2.99 million on Thursday alone, pushing weekly inflows to $7.11 million.

Institutional ETF Developments
Morgan Stanley submitted an amended S-1 registration statement with the Securities and Exchange Commission on Thursday for its Solana-based ETF carrying the ticker MSOL. This filing represents another milestone in growing institutional engagement with SOL.
Eight consecutive months of positive net inflows into SOL ETF instruments demonstrates consistent institutional commitment. Continued capital inflows through next week could potentially reverse the monthly balance from slightly negative to positive territory.
Real-World Asset Expansion on Solana
On the retail front, Solana has emerged as the dominant blockchain measured by RWA holder participation. The network now hosts more than 285,000 holders of tokenized Real-World Assets, with significant momentum from the tokenized SpaceX IPO offering.
However, derivatives market indicators present a contrasting narrative. SOL futures Open Interest contracted to $4.85 billion on Friday, declining from $5.18 billion on Wednesday.
Long position liquidations over the previous 24 hours totaled $13.66 million, while short liquidations amounted to merely $1.80 million, indicating seller dominance in the market.
Market analyst BATMAN observed that Solana experienced “rejection by its previous support level, now acting as resistance,” and that the stochastic oscillator reached the identical overbought territory that preceded the previous major peak.
CoinGlass liquidation heatmap analysis reveals concentrated leveraged positions clustered between $74 and $76. Additional liquidity pools are positioned near the $65–$66 range.
The primary support threshold remains anchored at $70. A confirmed daily close beneath this level could trigger a retest of June’s low around $62, with Fibonacci extension targets pointing toward $60.
Bullish traders require a definitive daily close above the descending trendline to reverse current momentum, with overhead resistance barriers positioned at $74.80 and $79.30.
Get 3 Free Stock Ebooks
Discover top-performing stocks in AI, Crypto, and Technology with expert analysis.
- Top 10 AI Stocks - Leading AI companies
- Top 10 Crypto Stocks - Blockchain leaders
- Top 10 Tech Stocks - Tech giants

