
 Dips Under $72 Amid Rising Bearish Sentiment and Negative Funding Rates")
Key Highlights
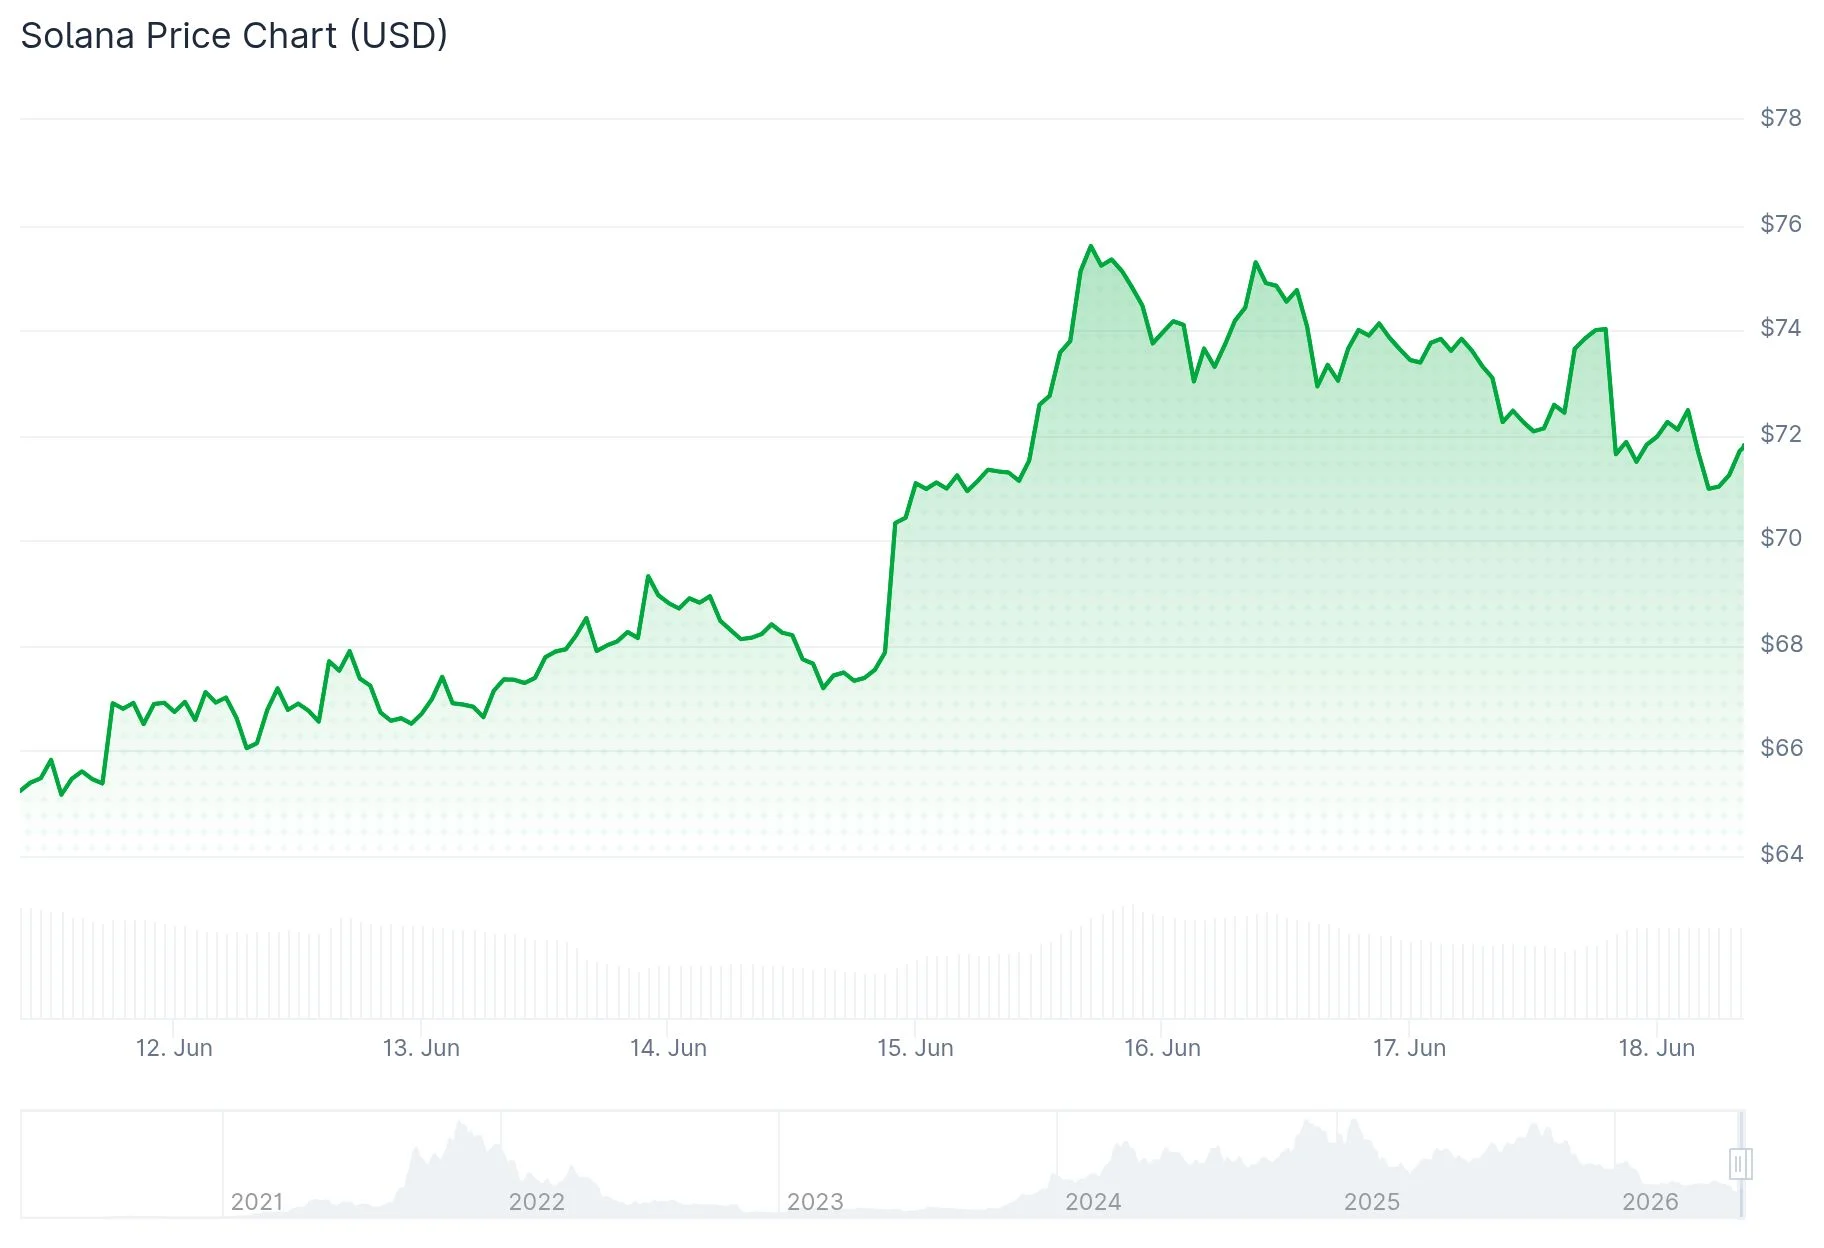
- SOL continues trading beneath the $72 threshold, shedding more than 2.5% across the past 48 hours.
- Exchange-traded funds registered $1.06 million in positive flows on Wednesday, extending a three-day streak.
- The current long-to-short ratio stands at 0.91, indicating heightened bearish positioning among traders.
- Funding rates have dipped into negative territory, signaling short sellers are compensating long holders.
- Technical analyst BATMAN highlighted that a previously supportive price zone has now become resistance, while the Stochastic oscillator shows overbought readings.
Solana (SOL) continues to face downward momentum, currently hovering around the $71 mark on Thursday. The cryptocurrency has shed over 2.5% during the last two trading sessions, remaining firmly positioned below critical moving average benchmarks.
While the price action reflects weakness, institutional interest shows signs of life. Spot Solana exchange-traded funds attracted $1.06 million in net capital on Wednesday, based on figures from SoSoValue. This represents the third straight session of positive investment flows this week.
Yet, these institutional inflows haven’t been sufficient to reverse the downtrend. Market derivatives metrics continue signaling bearish sentiment.
Thursday’s long-to-short ratio for SOL registered 0.91, per CoinGlass analytics. Values beneath 1.0 indicate that traders are predominantly positioning for further declines. This represents one of the lowest readings observed in more than 30 days.
Funding dynamics also shifted bearish on Tuesday, with rates at -0.0036% on Thursday. When funding turns negative, short position holders compensate long position holders—a clear indication that pessimistic wagers control the market.

Technical Analyst Highlights Critical Resistance Zone
Cryptocurrency analyst BATMAN published commentary on June 17, cautioning that SOL has encountered rejection at a price level that previously served as support but has now converted to resistance. Such role reversals typically carry bearish implications in chart analysis.
BATMAN further observed that the Stochastic momentum indicator has entered overbought zones—a configuration similar to conditions preceding the most recent significant price top. These technical patterns indicate SOL may encounter additional selling pressure unless demand materializes.
Examining the broader timeframe reveals SOL trading beneath its 50-day, 100-day, and 200-day Exponential Moving Averages (EMAs). All three trend indicators remain considerably above current pricing, contributing to structural bearish pressure.
Market analyst Daan Crypto Trades (@DaanCrypto) observed on June 16 that SOL appeared to be challenging a descending wedge formation against Bitcoin. He suggested a confirmed breakout could propel SOL higher alongside ecosystem-related tokens, though he emphasized the asset was still encountering resistance and warranted close monitoring.
Technical Indicators Show Conflicting Signals
The Relative Strength Index (RSI) currently registers approximately 44 on the daily timeframe—marginally below the neutral threshold but climbing from previously oversold territory. The MACD indicator has generated a bullish intersection, with the MACD line positioned at -2.80 above the signal line at -4.09, while the histogram displays a positive reading of +1.29.
These momentum indicators hint at emerging buying activity, though market observers emphasize that substantially stronger momentum is required before any meaningful trend reversal can be validated.
Solana has bounced from the $60–$64 support band established in recent weeks. The asset now trades above the middle Bollinger Band at $71.20, while upper band resistance hovers at $84.07.
Critical overhead resistance zones include $74.75 (corresponding to the 38.2% Fibonacci retracement), $77.07, and $79.27. Immediate support on the downside rests around $69.16, with the cycle bottom near $60.13 situated below.
As of current reporting, SOL posts a 24-hour trading volume of $4.26 billion alongside a market capitalization of $42.56 billion, reflecting a 24-hour decrease of 0.56%.
Get 3 Free Stock Ebooks
Discover top-performing stocks in AI, Crypto, and Technology with expert analysis.
- Top 10 AI Stocks - Leading AI companies
- Top 10 Crypto Stocks - Blockchain leaders
- Top 10 Tech Stocks - Tech giants

