



TLDR
- Market fear surrounding Solana has climbed to 2026 highs while trading volume slumped to yearly lows
- A substantial resistance barrier exists between $79 and $85 where approximately 105 million SOL tokens were previously traded
- A successful breach above $85 could pave the way toward $100 and potentially $127; failure may trigger a decline to $53 or below
- Network fundamentals remained robust during Q2 despite bearish price action and market sentiment
- Crypto analyst Michaël van de Poppe emphasizes that maintaining the $73–$76 support zone is essential for any rally beyond $100
Solana is currently experiencing its most intense period of fear, uncertainty, and doubt in 2026. Simultaneously, trading activity has plummeted to its weakest levels this year, data from blockchain analytics firm Santiment reveals.
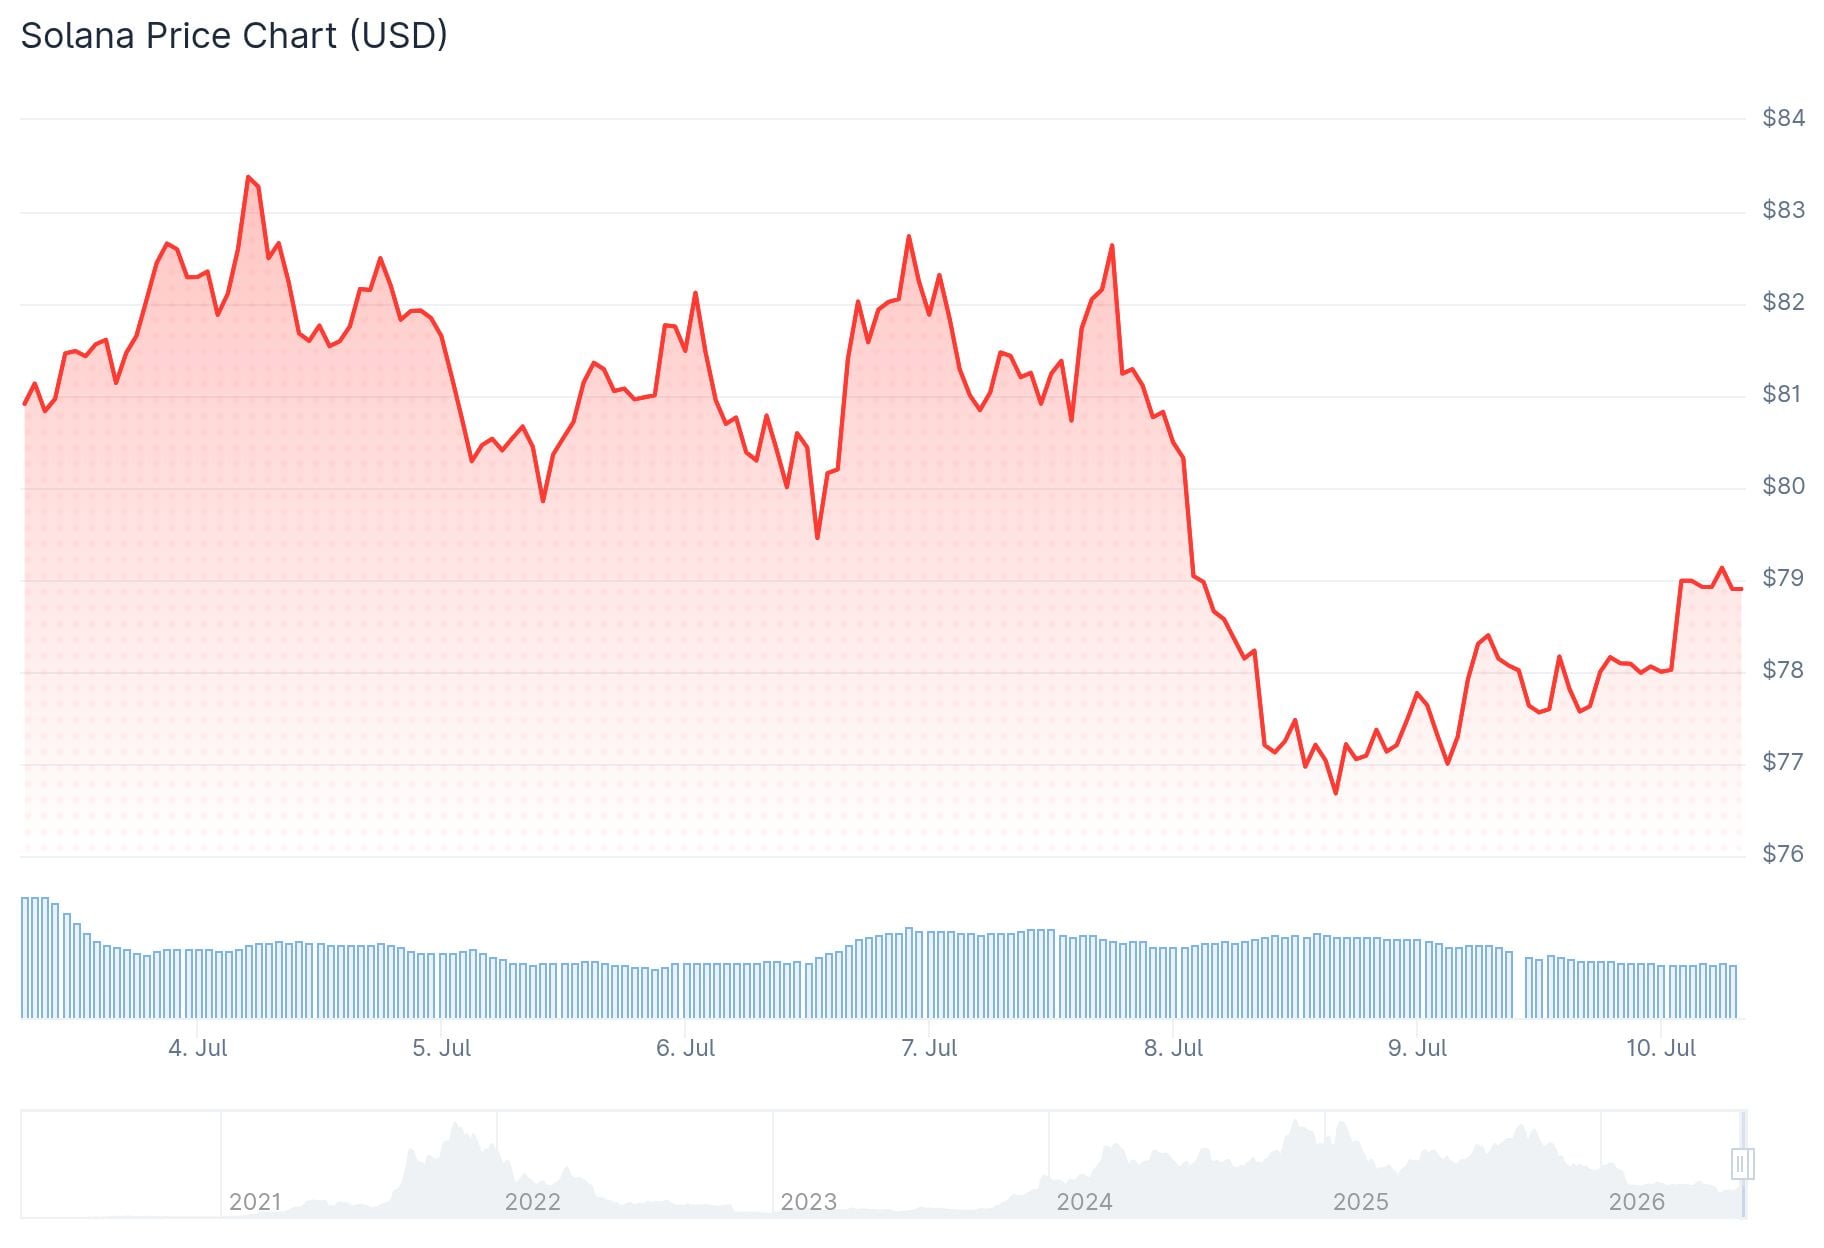
Market sentiment has shifted toward caution. Traders have expressed disappointment as SOL hasn’t delivered anticipated gains, even with increased focus on tokenized equities and real-world asset integration on the blockchain.
Santiment observed that the convergence of pessimistic sentiment and diminished trading volumes can occasionally weaken selling pressure. This environment may allow institutional buyers to accumulate positions with minimal resistance.
Crypto analyst Michaël van de Poppe shared his perspective on X, stating that maintaining support within the $73 to $76 zone with a subsequent bounce would signal market readiness for a move above $100. He cautioned that losing this critical range might result in fresh lows throughout the market.
Massive Resistance Zone Challenges SOL Bulls
Market analyst Ali Charts pointed out that approximately 105 million SOL tokens exchanged ownership within the $79–$85 price range. This concentration creates a formidable resistance barrier, as numerous holders approaching breakeven prices may choose to exit their positions.

Should buyers successfully drive SOL above $85 and establish it as a new support floor, the subsequent price objectives would be $100 followed by $127. Conversely, a rejection at this resistance could result in a pullback toward $53, with additional support zones located between $45 and $36.
Analyst Astekz similarly identified $45.60 and $36.64 as significant downside targets should SOL fail to maintain its current trading range.
Robust On-Chain Metrics Contrast Price Weakness
Despite prevailing bearish sentiment, Solana’s second-quarter blockchain data painted a markedly different picture. The network handled approximately 100 million transactions daily. Daily active addresses maintained an average of 1.93 million, while daily decentralized exchange volume reached $2.09 billion.
Decentralized applications built on Solana produced $262 million in revenue throughout Q2. This achievement marked the ninth consecutive quarter where Solana led all blockchains in Web3 application revenue, capturing 41% of the aggregate total.
Real-world assets deployed on the network expanded from $2 billion in March to surpass $3.48 billion by July. Stablecoin transaction volume touched $1.79 trillion in June, representing a 63% increase from May figures.
Pump.fun contributed $91.43 million in revenue during the second quarter. Early July witnessed the network’s first week exceeding one billion non-vote transactions.
SOL currently finds itself suspended between solid blockchain fundamentals and hesitant trader sentiment, with the $79–$85 supply concentration representing the decisive level for near-term price direction.
Get 3 Free Stock Ebooks
Discover top-performing stocks in AI, Crypto, and Technology with expert analysis.
- Top 10 AI Stocks - Leading AI companies
- Top 10 Crypto Stocks - Blockchain leaders
- Top 10 Tech Stocks - Tech giants


