
 Hits Historic Low After Eight Months of Continuous Decline")
Key Takeaways
- SOL has experienced an unprecedented eight consecutive months of declines, marking its worst performance streak ever recorded.
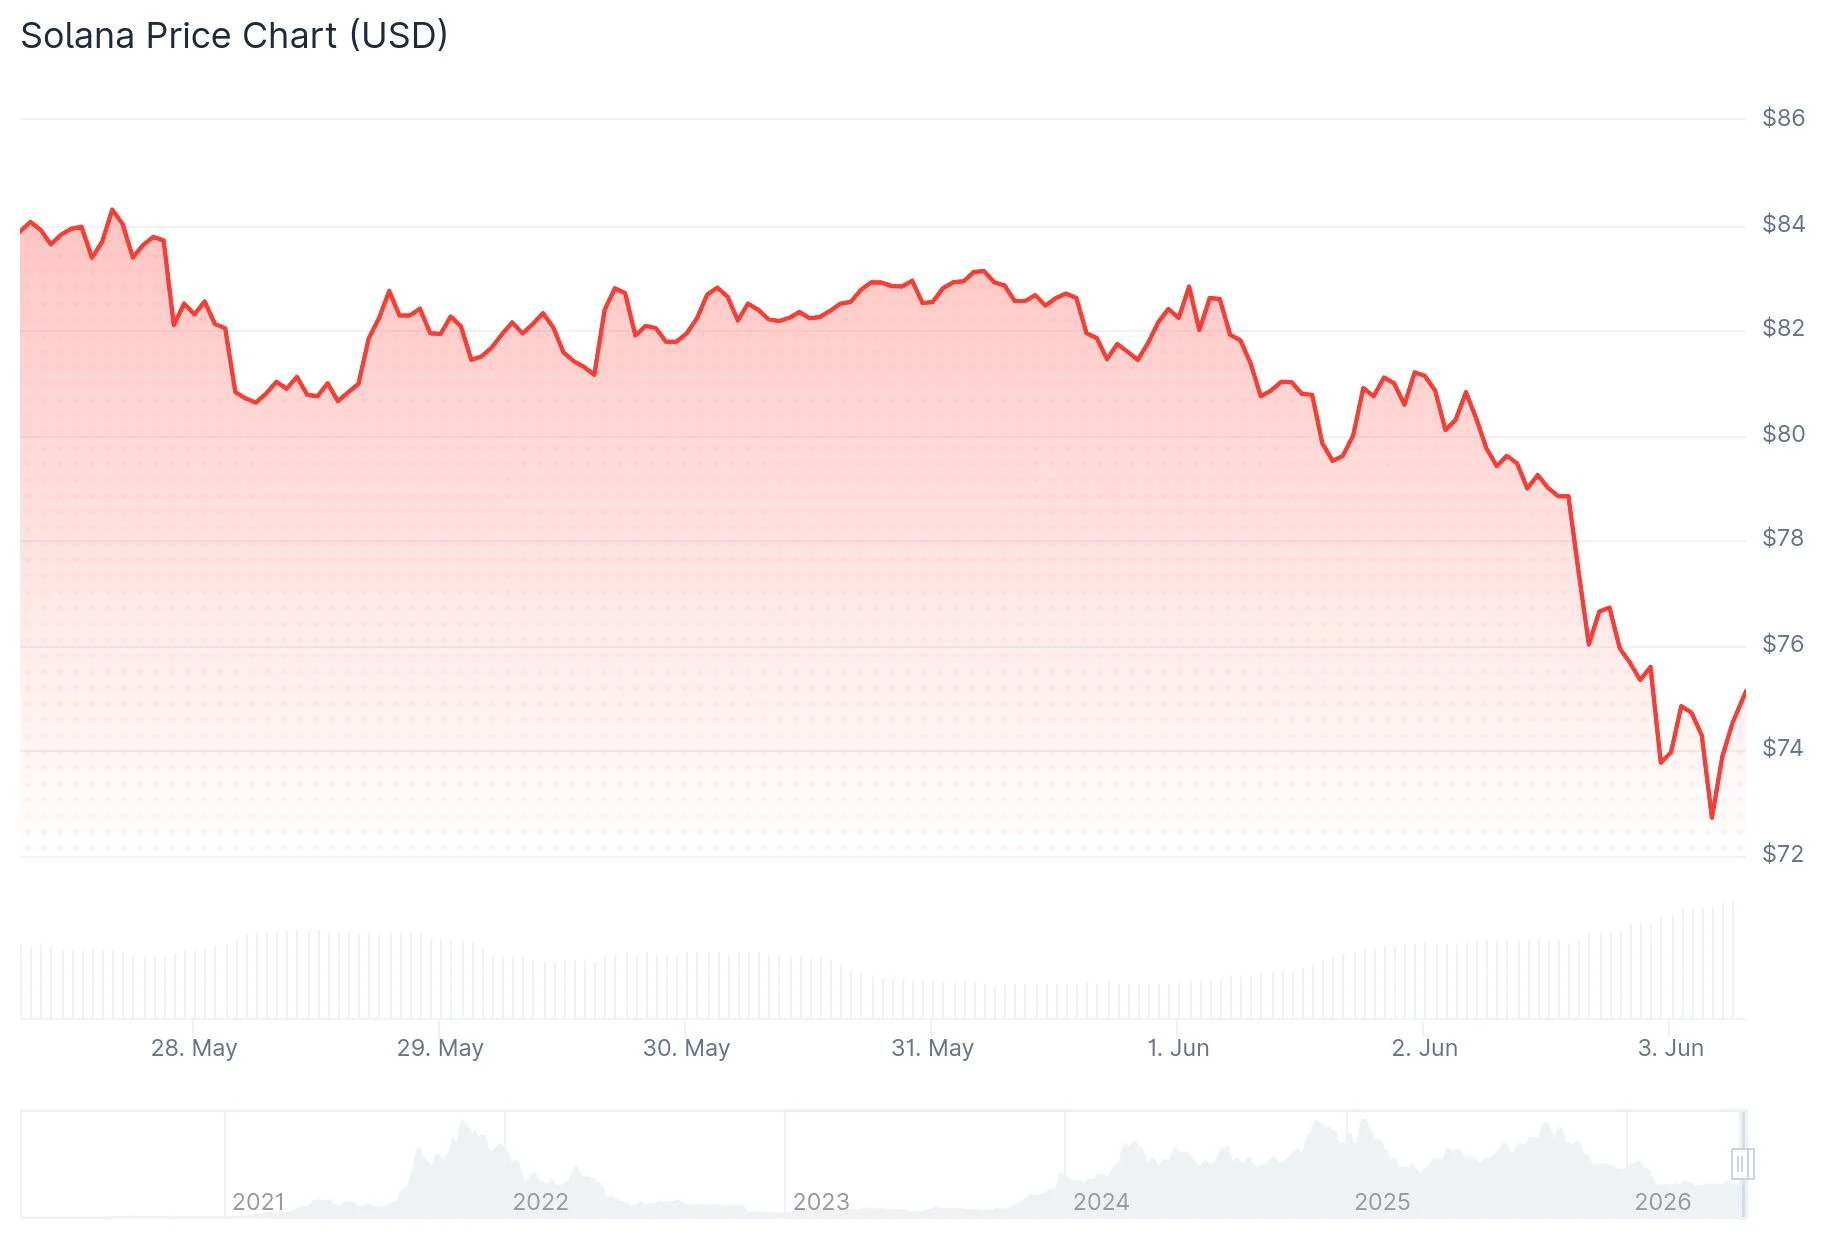
- The cryptocurrency breached critical $80 support, reaching as low as $75.58, with analysts watching $70 as the next significant level.
- DEX activity on Solana plummeted 82% during late May, dropping from $104.3 billion to $18.8 billion in weekly volume.
- Bitcoin ETF withdrawals hit $1.42 billion for the week concluded May 29, continuing an eleven-day outflow streak.
- Technical analyst CryptoBullet forecasts potential decline to $50 territory by July if current downtrend persists.
Solana (SOL) experienced approximately 5% losses on Tuesday amid broader cryptocurrency market weakness. The overall digital asset market capitalization declined 3.44% within a 24-hour timeframe. Exhibiting characteristic high-beta behavior, SOL suffered steeper losses than most cryptocurrencies, initially touching $77 before descending to an intraday bottom of $75.58.
This downturn marks Solana’s eighth straight month in negative territory, establishing an unwelcome record as the longest continuous decline since the network’s launch. Year-to-date 2026 performance shows SOL down 36.4%. Comparatively, Ethereum has declined 33.5% during the identical timeframe, a notable data point considering Solana’s previous positioning as a superior growth alternative to ETH.
U.S.-based Bitcoin spot ETFs recorded $1.42 billion in aggregate outflows during the week concluded May 29, extending the redemption pattern to eleven consecutive trading sessions. Market observers interpret this as institutional investors retreating from riskier asset classes. Historically, diminished Bitcoin ETF appetite correlates with amplified selling pressure on alternative cryptocurrencies like SOL.
Network Activity and DEX Metrics Show Deterioration
Blockchain analytics reveal additional bearish indicators. Weekly decentralized exchange volume on Solana contracted 82% throughout May’s latter half, collapsing from $104.3 billion to merely $18.8 billion as speculative meme token interest evaporated. Daily active addresses maintain approximately 2.1 million, securing SOL’s third-place ranking among Layer 1 protocols for this metric. However, financial performance metrics present a contrasting narrative: throughout the previous twelve months, Solana accumulated $317.6 million in fees while generating only $39.1 million in actual revenue, an efficiency ratio that pales against Tron’s $3.1 billion performance.
SOL maintains its position as the seventh-largest cryptocurrency by market valuation at $44.58 billion.

Chart Analysis Suggests Further Downside
The previously resilient $80 support zone, which withstood numerous tests over recent months, has definitively broken. Technical theory suggests that repeatedly tested support levels, once breached, frequently transform into resistance barriers. TradingView’s comprehensive moving average analysis, spanning timeframes from 10-period through 200-period intervals, uniformly displays Sell recommendations. The Relative Strength Index registers 29.38, technically entering oversold territory, though prevailing downtrends often sustain selling pressure despite oversold readings rather than triggering rebounds.
Open interest has contracted to $5.48 billion while funding rates hover near neutral at -0.0025%, indicating minimal concentrated short positioning that might fuel a short squeeze.
Market analyst CryptoBullet, who characterized the technical formation as a “big breakdown,” anticipates Solana potentially descending toward the $50 zone by July. Immediate projections identify $70 as the probable next target should the $75–$78 range fail to provide support. Establishing a credible trend reversal would require SOL to successfully recapture $80 followed by breakthrough above $85.
SOL has declined 9.23% over the current week, 46.63% across six months, and 38.05% year-to-date. Five-year performance still reflects gains of 149.62%.
Get 3 Free Stock Ebooks
Discover top-performing stocks in AI, Crypto, and Technology with expert analysis.
- Top 10 AI Stocks - Leading AI companies
- Top 10 Crypto Stocks - Blockchain leaders
- Top 10 Tech Stocks - Tech giants

