
 Price: Can SOL Recover After Hitting Multi-Year Lows at $60?")
Quick Overview
- SOL has recovered from the $60 support zone and currently trades in the $64–$69 corridor, though it sits beneath critical exponential moving averages
- Market derivatives indicate bearish sentiment: the long-to-short ratio dropped to 0.94 while funding rates have shifted into negative territory
- Solana has recorded eight straight monthly declines, representing its longest losing streak ever
- Technical analyst BATMAN identified a symmetrical wedge pattern containing SOL, with concerning MACD divergence beneath the 200 EMA positioned around $74
- Spot Solana ETF products registered $137,290 in net capital inflows on Tuesday, indicating continued institutional participation
Solana has managed to climb away from the $60 threshold, though the rebound appears tentative. Currently hovering near $69, the token remains beneath significant moving average barriers and confronts multiple resistance zones.
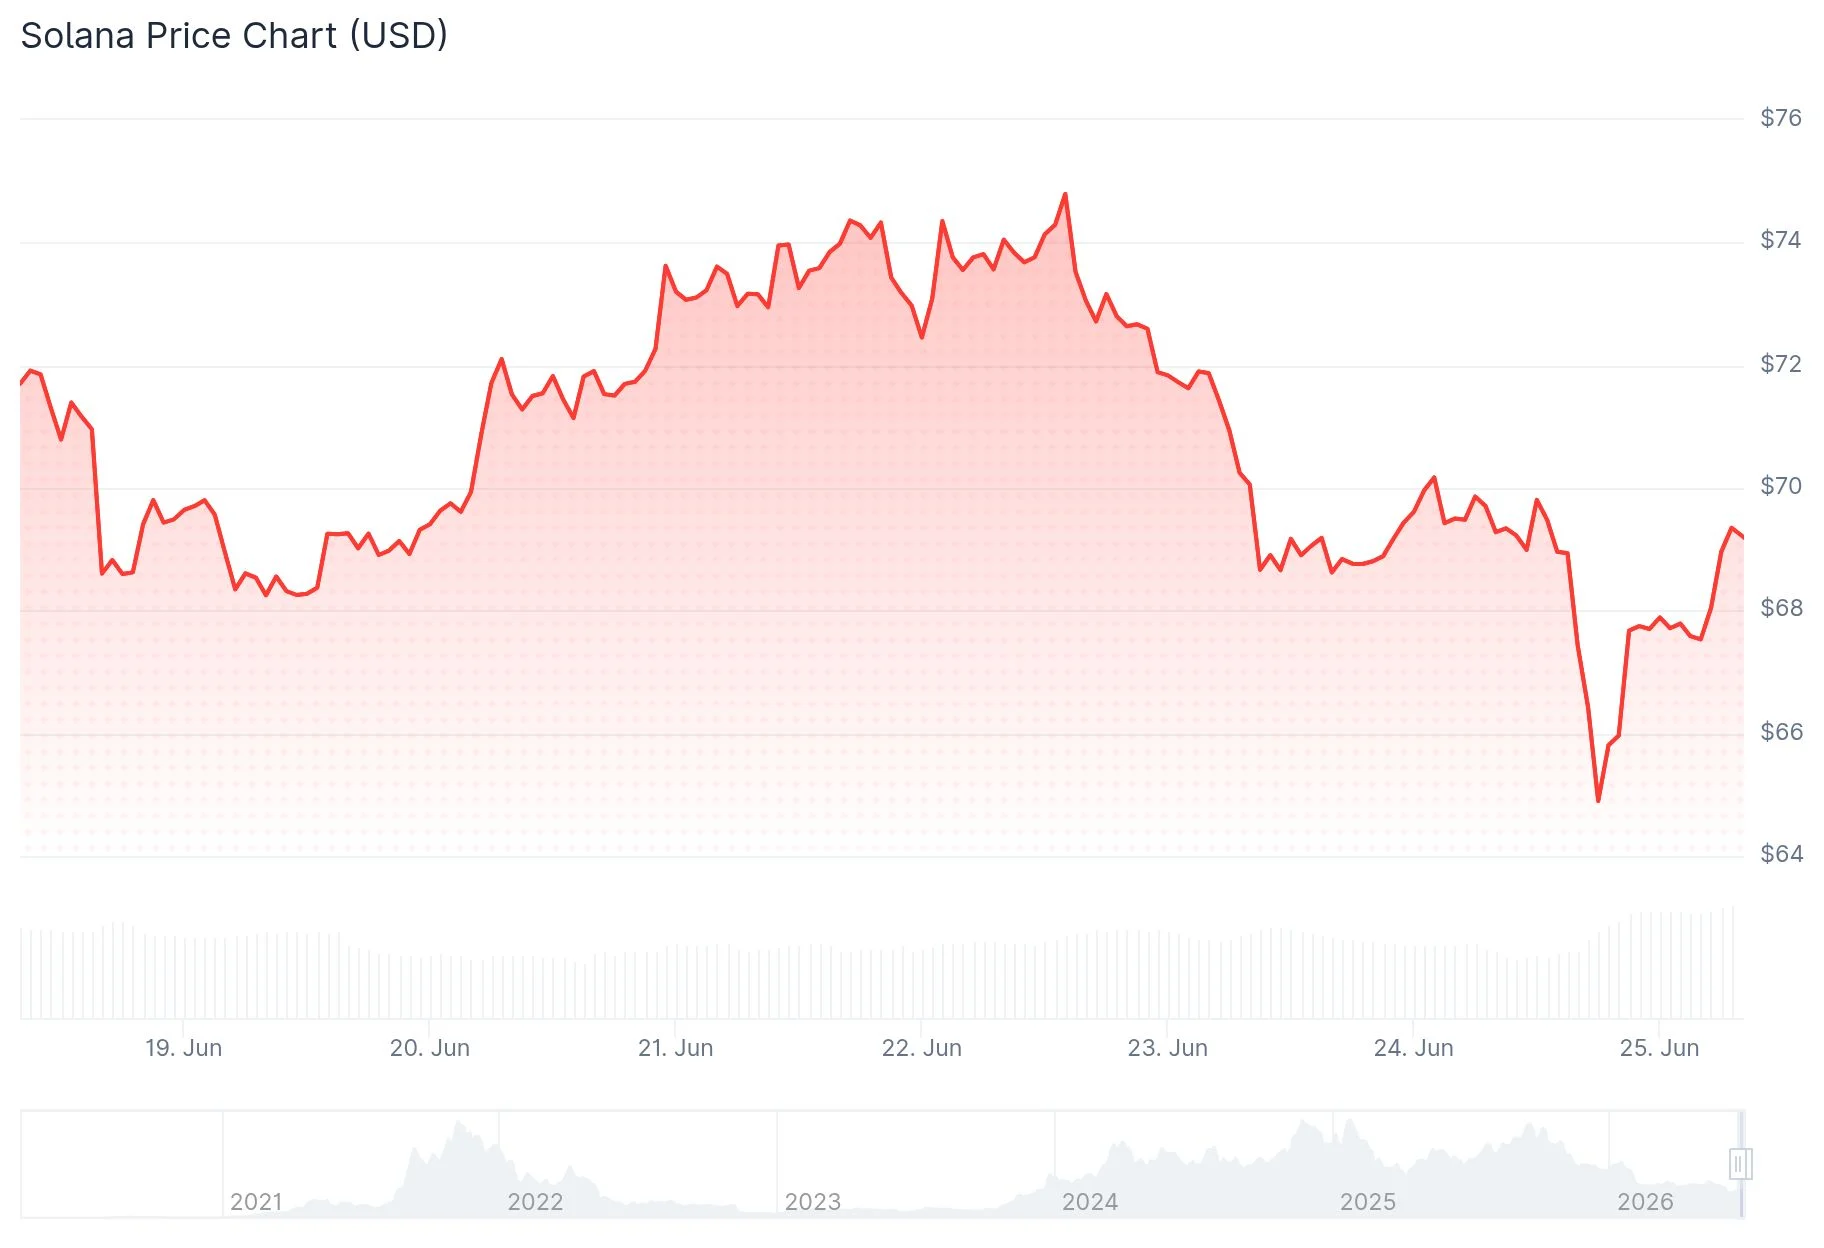
The $60 region has emerged as a critical psychological floor. Market participants initiated buying activity at this level, temporarily driving SOL higher by more than 5% within a 24-hour window. However, selling momentum continues to dominate higher price zones.
Derivatives market signals paint a concerning picture. According to CoinGlass data, Solana’s long-to-short ratio contracted to 0.94 by Wednesday. When this metric falls beneath 1.0, it indicates that short positions have surpassed long positions, reflecting pessimistic market positioning among active traders.
Funding rates have also shifted into negative territory this week, registering -0.0080% on Wednesday. Negative funding rates require short position holders to compensate long position holders, a dynamic that generally indicates trader expectations for continued price deterioration.
Cryptocurrency chartist BATMAN highlighted on June 24 that SOL remains constrained within an extensive symmetrical wedge formation. Price volatility is contracting as the pattern approaches its apex, while the asset battles to maintain ground below the 200 EMA situated near $74. The MACD indicator displays bearish divergence with diminishing momentum. BATMAN emphasized that Solana is “running out of room” and questioned whether SOL would breach the $69 support.

Critical Resistance Zones Ahead
SOL currently trades beneath its 50-day, 100-day, and 200-day exponential moving averages. This configuration creates a layered resistance structure that bulls must overcome.
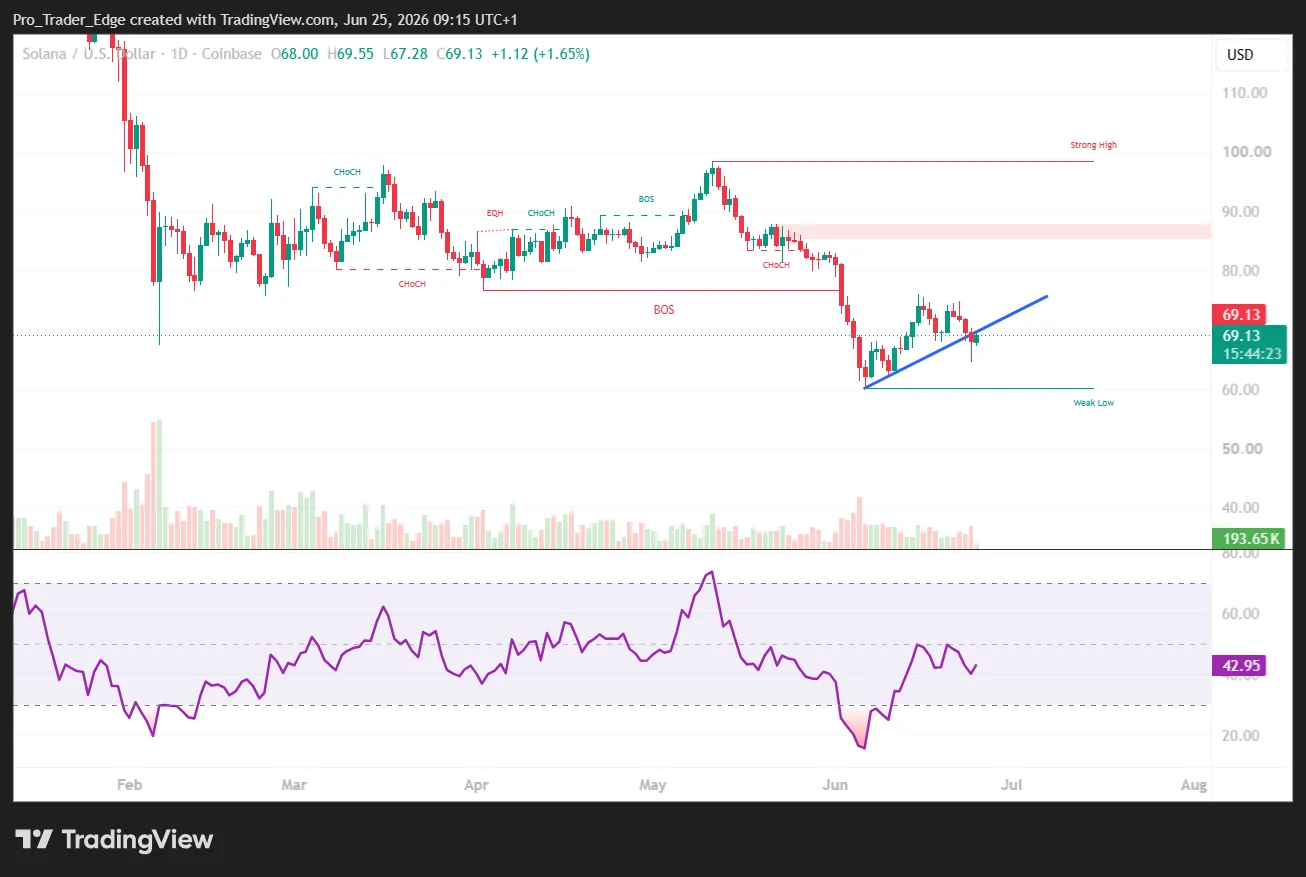
The initial obstacle appears around $74.75. Beyond this level lies the 50-day EMA positioned near $76.18. A more substantial upward movement could challenge the 50% Fibonacci retracement level at $79.27, followed by the 100-day EMA at $83.03.
The MACD indicator on the 4-hour timeframe shows signs of flattening, while the RSI hovers near 46, remaining beneath the neutral 50 threshold. Neither momentum indicator provides evidence supporting an imminent powerful rally from present levels.
The monthly timeframe reveals particularly severe conditions. Market analyst Ash Crypto observed that SOL has generated eight consecutive red monthly candles, an unprecedented occurrence in the token’s trading history. The monthly RSI has reached more oversold territory than during the 2022 FTX crisis, when SOL plummeted to approximately $8.
Positive Indicators Emerge
Not all data suggests further downside. Spot Solana ETF products recorded $137,290 in net capital inflows on Tuesday, based on SoSoValue tracking. While relatively modest, this figure demonstrates that institutional appetite persists.
Several market observers are monitoring the $50–$40 range as a possible accumulation territory. Rod’s technical projection suggests that if SOL establishes a foundation within this zone, a longer-term recovery trajectory toward $175 could materialize. Trader Symba’s SOL/BTC pair analysis identifies a substantial long-term demand area in proximity, with expectations for eventual movement toward new peaks above $300.
CryptoJack identified a trendline breakout on the 1-hour chart, suggesting that immediate downward pressure may be subsiding. Essential support levels to maintain are $62–$63, with upside objectives positioned at $68, $70, and subsequently $76.
As of Wednesday, SOL’s long-to-short ratio remained at 0.94 with funding rates at -0.0080%, while the price fluctuated around $69.58.
Get 3 Free Stock Ebooks
Discover top-performing stocks in AI, Crypto, and Technology with expert analysis.
- Top 10 AI Stocks - Leading AI companies
- Top 10 Crypto Stocks - Blockchain leaders
- Top 10 Tech Stocks - Tech giants

