
 Price Eyes $100 Breakout as Network Metrics Surge")
Key Takeaways
- Solana (SOL) is hovering around its 50-day EMA at the $75 mark, representing a crucial technical threshold.
- Growing retail enthusiasm is evident through climbing funding rates while Open Interest maintains above the $5 billion threshold.
- ETF flows remain inconsistent, with Wednesday’s $2.50 million outflow following Tuesday’s $5.52 million inflow.
- Network metrics from Grayscale reveal approximately 100 million transactions daily with 4.3 million active users.
- Crypto analyst Michaël van de Poppe identifies $77 as a pivotal breakout level that could propel SOL toward $125-$130.
Solana currently trades around $75 on Wednesday, positioning itself at a technically significant junction. The cryptocurrency is challenging its 50-day Exponential Moving Average, a threshold that market participants monitor for directional cues.
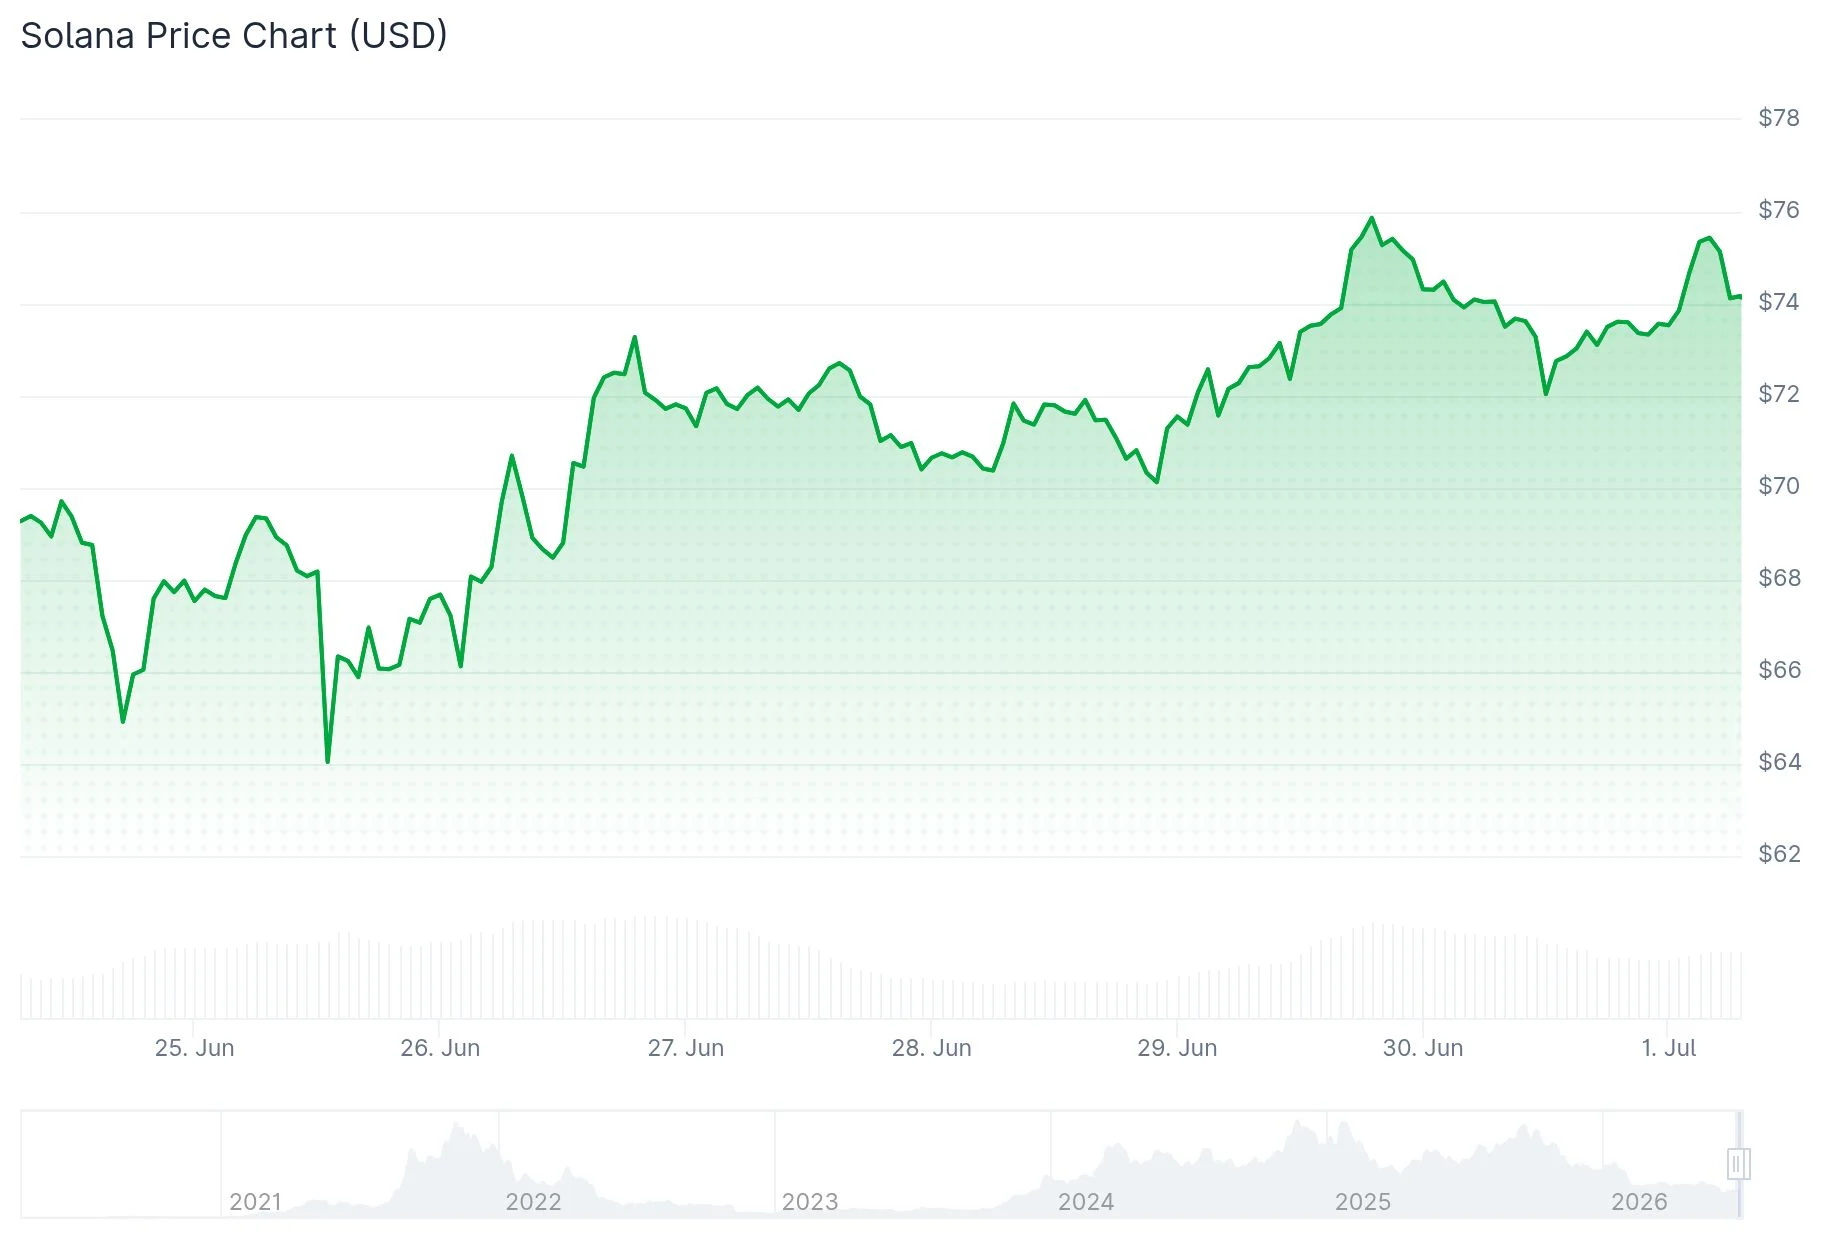
Successfully closing above this technical marker would clear the runway toward the 200-day EMA positioned near $98.79. Such movement would bring SOL tantalizingly close to reclaiming the psychologically important $100 level not seen in several weeks.
Retail participation shows signs of strengthening. According to CoinGlass metrics, Open Interest currently stands at $5.33 billion, maintaining stability above the $5 billion threshold following last month’s decline.
Funding rates—a key indicator reflecting demand for leveraged long positions—climbed to 0.0073% on Wednesday. This uptick demonstrates traders’ willingness to absorb higher costs to maintain bullish exposure to SOL.
Mixed Signals from Institutional Capital
Exchange-traded fund movements paint a more ambiguous picture. Solana-focused ETFs recorded $2.50 million in net outflows on Wednesday, completely reversing the previous day’s $5.52 million inflow.

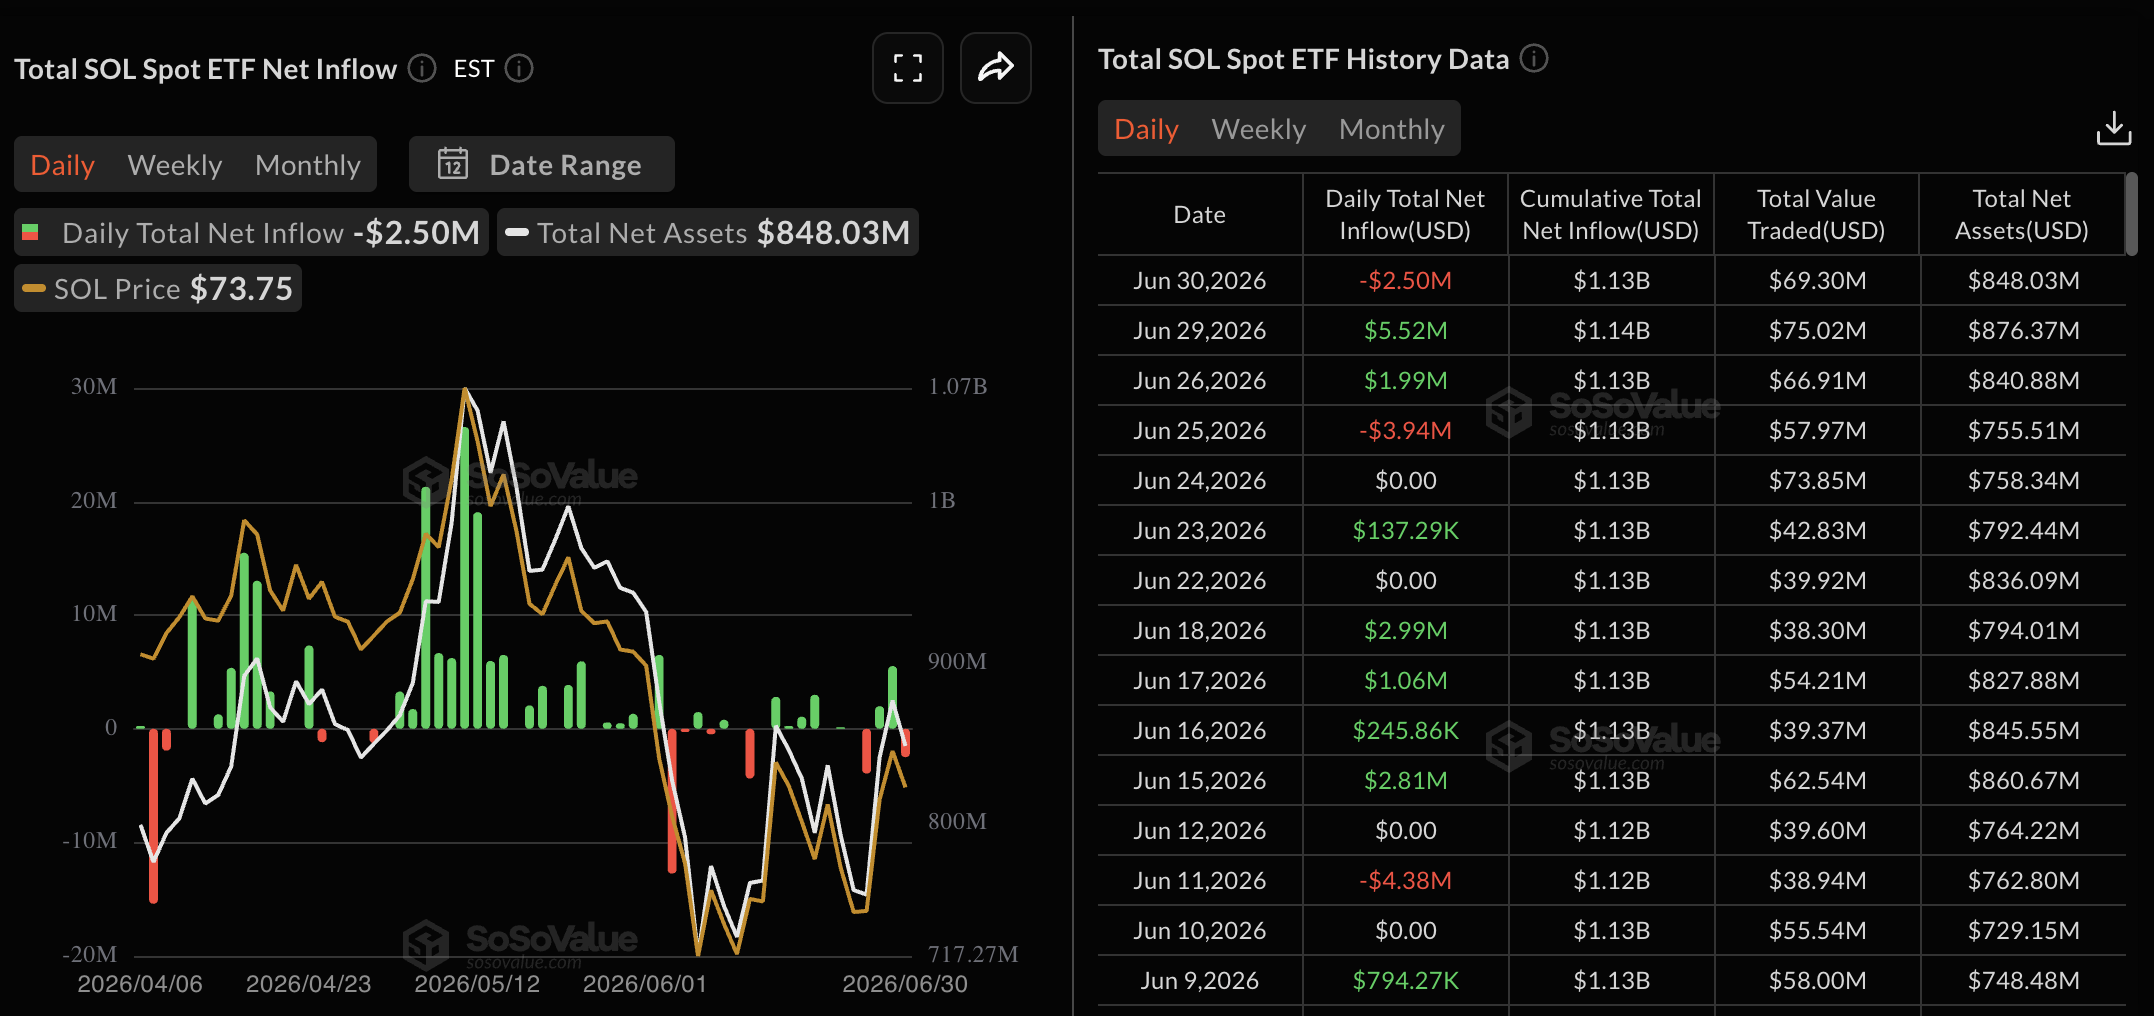
This whipsaw behavior suggests institutional players are adopting a cautious, observational approach rather than establishing decisive positions.
Technical indicators present a cautiously optimistic outlook. The Relative Strength Index registers at 55, positioned slightly above neutral territory, while the MACD indicator trends upward toward bullish confirmation.
Should SOL surrender the 50-day EMA support, market observers anticipate a potential retest of the February 6 bottom at $67.50. A more pronounced breakdown beneath the $60 threshold would compromise the asset’s technical foundation.
Crypto strategist Michaël van de Poppe shared on X that Solana’s shorter-timeframe patterns “actually do look good.” He identified a breakout above the range resistance at $77 as the catalyst that could drive prices toward the $125-$130 zone.
His technical assessment provides additional perspective for market participants evaluating whether retail momentum possesses sufficient strength to overcome resistance barriers.
Blockchain Metrics Continue Upward Trajectory
Beyond market dynamics, Grayscale documented sustained activity across the Solana network infrastructure. The investment firm recorded approximately 1,200 transactions per second alongside roughly 100 million daily transactions.
Grayscale further noted 4.3 million distinct daily active users and cumulative transaction fees exceeding $100 million year-to-date.
The asset manager highlighted Raydium, Pump.fun, and GEODNET as prominent applications driving user engagement on the platform.
Current price action near $72.76 rests immediately above a historically significant demand zone that previously attracted buyer interest, per onchain analytics. This support level has maintained integrity throughout the current week.
Market participants now focus on whether SOL can consolidate and build upon present levels or whether weakness will trigger a retreat toward established support regions in coming sessions.
Get 3 Free Stock Ebooks
Discover top-performing stocks in AI, Crypto, and Technology with expert analysis.
- Top 10 AI Stocks - Leading AI companies
- Top 10 Crypto Stocks - Blockchain leaders
- Top 10 Tech Stocks - Tech giants

