
 Price Faces Critical Test: Can Bulls Reclaim $78 or Face Deeper Decline?")
Key Takeaways
- Solana is currently hovering around $68–$69 following a sharp 5–7% decline within a 24-hour period, testing crucial support territory
- Bulls face a pivotal challenge: breaking through the $75–$78 resistance barrier to prevent additional downside pressure
- A major whale trader initiated a 20x leveraged short position on 554,680 SOL (approximately $38 million) around the $69 mark, intensifying bearish sentiment
- Should the $60 support level fail to hold, market watchers anticipate potential movement into the $40–$30 territory
- Technical indicators via MACD histogram suggest declining selling momentum, though caution remains warranted
Solana has experienced substantial downward movement throughout the past day, shedding over 5% to settle in the $68–$69 trading zone. The cryptocurrency is hovering near its daily floor, with bearish forces dominating near-term market dynamics.
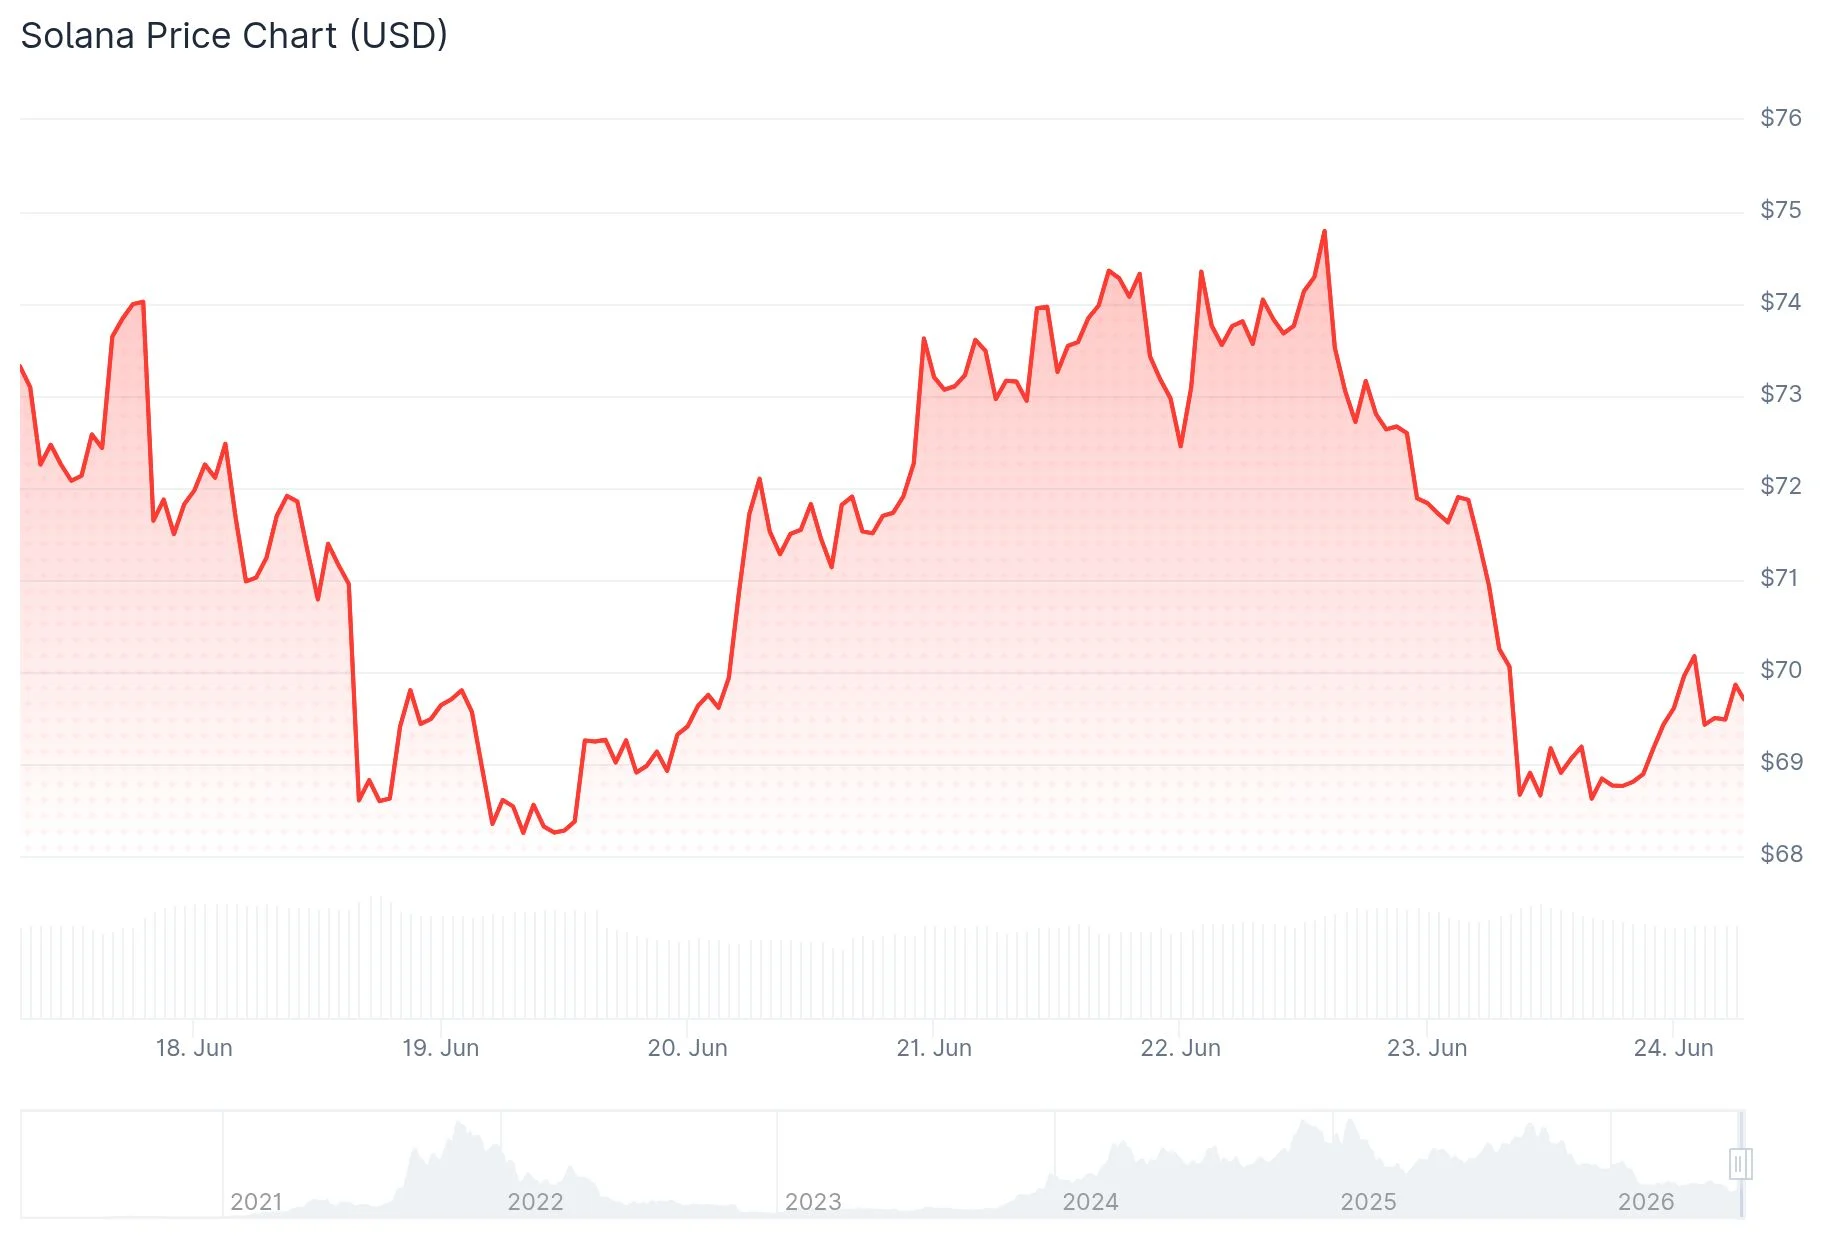
Current market data shows SOL registering a 24-hour trading volume approaching $5.07 billion, while maintaining a market capitalization of approximately $39.92 billion. Today’s price action has ranged between a low of $68.41 and a high of $72.80.
Although the asset attempted a modest rebound during the trading session, it couldn’t sustain momentum above the $70 threshold, subsequently retreating toward the bottom of its daily range.
Major Whale Establishes Substantial Short Position
According to blockchain monitoring service Lookonchain, a significant market participant established a 20x leveraged short trade involving 554,680 SOL tokens, representing roughly $38.15 million in notional value. This position was initiated near the $69.23 price point, with breakeven calculated at approximately $69.19.
Given that SOL continues trading near this threshold, the short position maintains proximity to profitability. Extended trading below the $69–$70 range keeps this bearish bet in favorable territory and contributes to negative market psychology.

Cryptocurrency analyst Sjuul from AltCryptoGems observed on June 22 that selling pressure continues dominating SOL’s price action, though buyers are attempting localized defense. The analyst emphasized that successfully flipping the $78 level represents the critical objective for bullish traders, identifying it as a catalyst for a “power of 3” expansion pattern — while cautioning against aggressive long positioning until that threshold is decisively recovered.
Recapturing $70 followed by $72 would start alleviating bearish momentum, but absent such recovery, market attention remains fixed on downside targets at $68, $64, and $60.
Critical Resistance Zone Between $75–$78 Demands Attention
Analysts are concentrating their focus on the $75–$78 price corridor. This region has been identified as the crucial resistance threshold for Solana’s recovery prospects. A decisive break and hold above $78 would establish pathways toward $85, subsequently targeting the $90 area.
Conversely, rejection at this resistance zone would preserve the bearish framework. Failure to breach these levels could redirect price action toward the $64–$60 range.
Breaking beneath $60 would activate longer-term cycle projections pointing toward a support corridor spanning $55 to $40, where accumulation may potentially materialize.
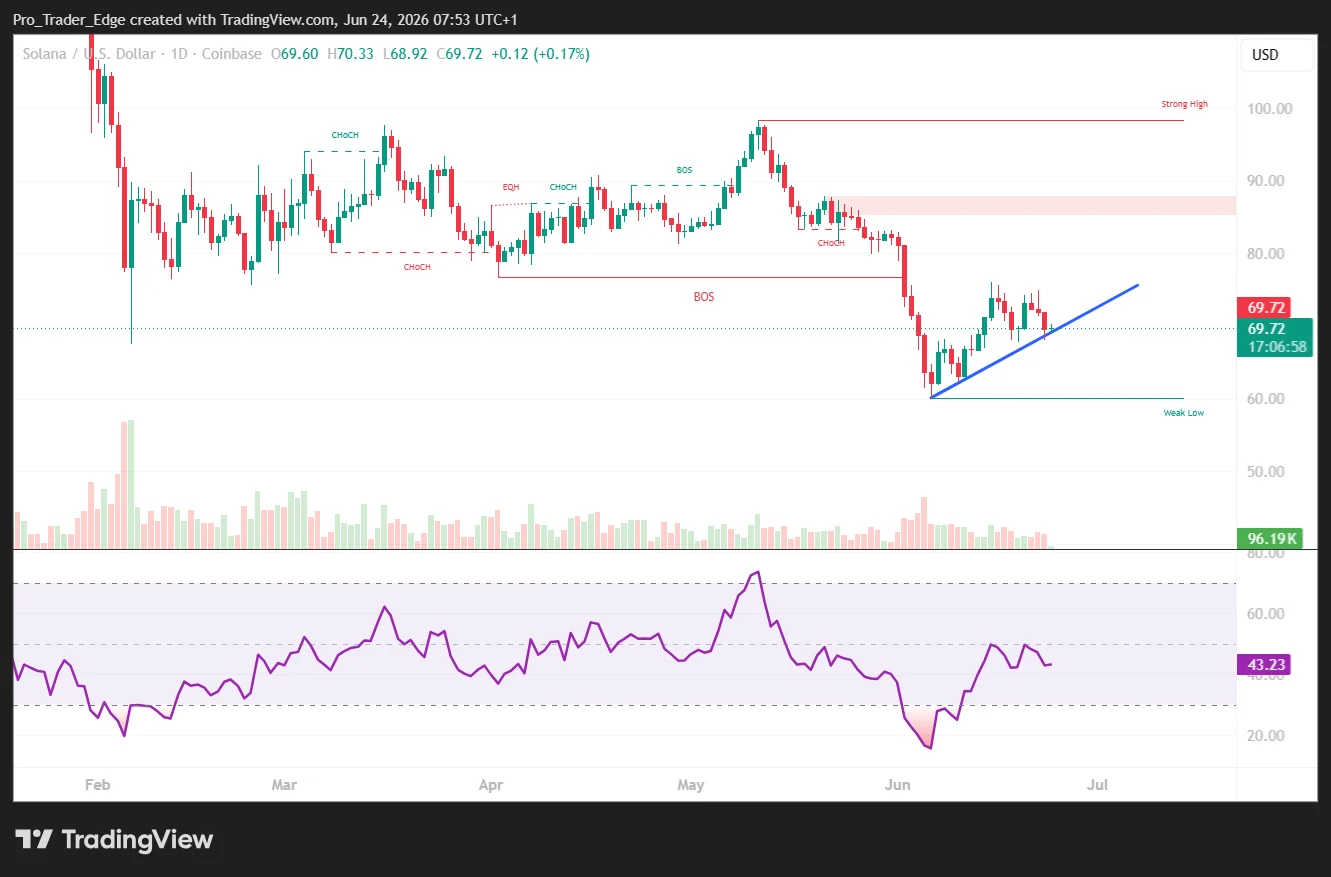
From a technical perspective, the MACD indicator shows the main line positioned at -1.81 relative to a signal line reading of -2.59, producing a histogram value of +0.79. These readings indicate potentially moderating downside momentum, though genuine reversal confirmation requires price action breaking above the middle Bollinger Band situated near $68.72.
The upper Bollinger Band rests at $75.69, corresponding with the resistance territory highlighted by market analysts.
Solana has maintained a weakened trend structure since October 2025, with price action continuing beneath the broader $80–$90 reclamation zone that would need to be conquered for establishing healthier trend dynamics. Latest trading data positions SOL near $69, marginally below the $70 level representing bulls’ initial recovery target.
Get 3 Free Stock Ebooks
Discover top-performing stocks in AI, Crypto, and Technology with expert analysis.
- Top 10 AI Stocks - Leading AI companies
- Top 10 Crypto Stocks - Blockchain leaders
- Top 10 Tech Stocks - Tech giants

