
 Rallies 20%: Critical Resistance Level Now in Focus")
TLDR
- Solana has rallied more than 20% from its early June bottom around $60, currently hovering near $75
- SOL is challenging a crucial prior support area at $75.7 that may unlock moves toward $83.5, $90, and $98
- Technical analyst Satoshi Flipper identifies a falling wedge pattern breakthrough with a projected $250 price objective
- Trader Daan Crypto Trades notes SOL emerging from a consolidation wedge versus BTC, monitoring for sustained momentum
- Technician Crypto Coral highlights a bearish flag breakdown risk, cautioning that rejection could trigger renewed selling
Solana has mounted an impressive comeback from its June depths, gaining over 20% within days. This rally has positioned SOL at a critical technical juncture that may determine its trajectory in the weeks ahead.
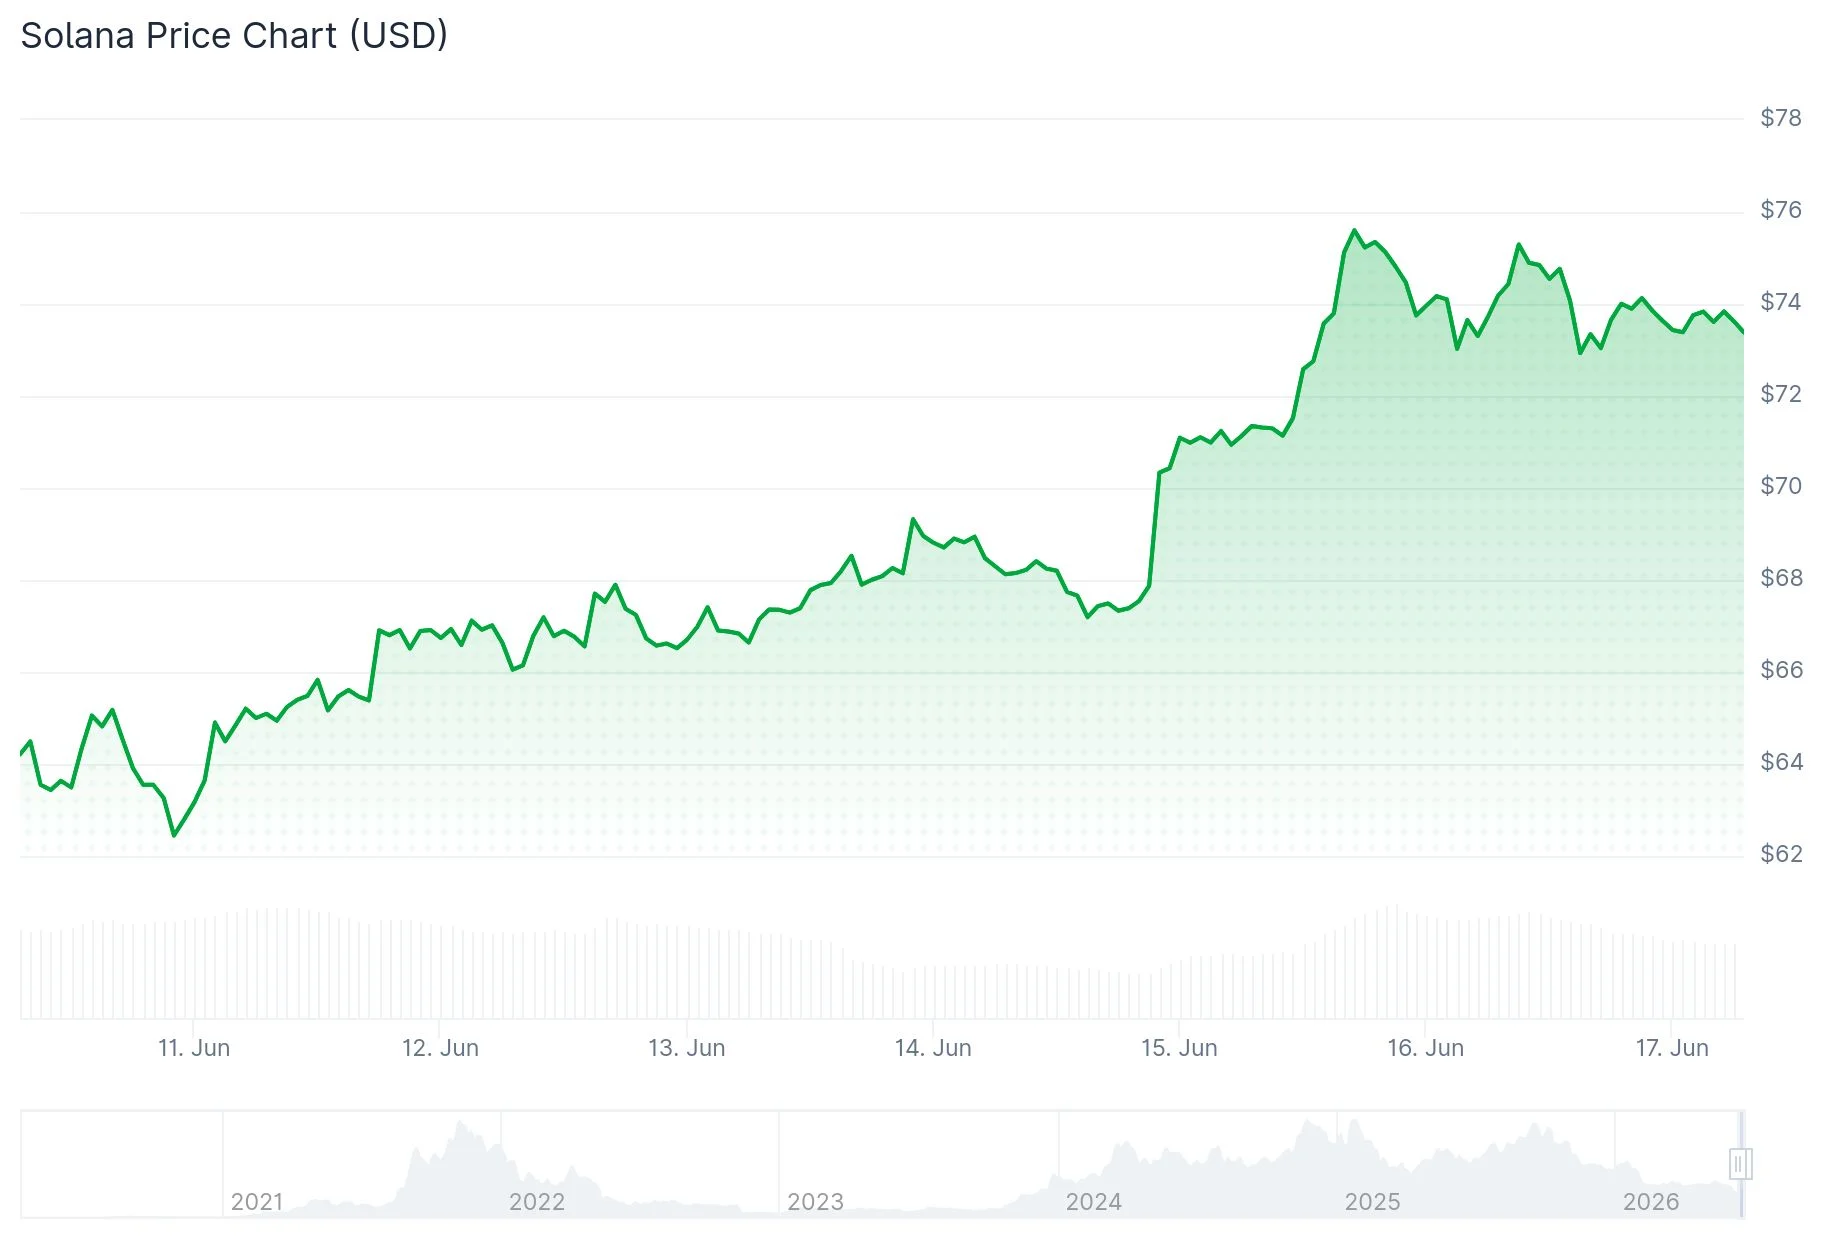
On June 16, Solana was changing hands around the $75 mark, representing a significant bounce from the approximately $60 lows recorded earlier this month.
The upswing gained momentum from positive macroeconomic developments. News emerged that the United States and Iran had established a preliminary framework agreement to ensure passage through the Strait of Hormuz, alleviating inflationary pressures. Crude oil declined on the announcement, while Bitcoin, Ethereum, and other risk-on assets rallied in response.
Derivatives metrics confirmed the bullish sentiment. Data from CoinGlass indicated expanding open interest accompanying the price advance. Short squeeze activity, evidenced by cascading liquidations of bearish positions, provided additional thrust from the low $60s to present levels.
On the institutional front, Solana Company turned down a non-binding takeover bid from Forward Industries dated June 15. The proposal represented a premium valuation and arrived amid intensifying competition among companies pursuing SOL-centric treasury allocation strategies.

What the Charts Are Showing
Analyzing the daily timeframe, Solana consolidated for approximately four months within a defined range bounded by $75.7 support and $98.3 resistance. This pattern collapsed in early June when price breached the range floor and descended toward $60.
SOL has now retraced back to test that former support boundary. A definitive reclaim above the range would negate the bearish breakdown and bring intermediate targets at $83.5, $90, and ultimately $98.3 back into play.
Examining the four-hour timeframe, SOL has penetrated above a declining trendline that had restricted upward attempts since late May. The RSI has recovered above the neutral 50 threshold after dipping into oversold territory, while the MACD histogram has begun displaying bullish divergence.
Trader Daan Crypto Trades shared on X that SOL appears to be escaping from a consolidation wedge formation relative to BTC. He observed that a confirmed breakout could catalyze additional gains and lift select Solana ecosystem tokens, though he emphasized watching the current zone as critical resistance.
Satoshi Flipper detected a falling wedge completion on the daily chart, with price successfully recapturing the upper boundary near $70. The analyst established a long-range projection at $250, representing a return to pricing levels observed during Solana’s previous bull market peak.
Resistance and Downside Levels to Watch
More Crypto Online pinpointed a concentrated Fibonacci resistance zone spanning $69.44 to $72.58 on the four-hour chart, where multiple technical confluences intersect—including the 38.2% retracement level, 100% Elliott Wave extension, and 50% retracement.
Not every analyst maintains a bullish outlook. Crypto Coral cautioned on June 16 that Solana had violated a bearish flag pattern and is now retesting significant EMA resistance barriers. The analyst suggested that failure to reclaim this threshold could precipitate another downward wave.
Should $75 fail to function as support, subsequent downside targets include $71.8, $69.1, and the June nadir near $60.
The Supertrend indicator on the four-hour chart currently identifies dynamic support in the vicinity of $70.9.
Get 3 Free Stock Ebooks
Discover top-performing stocks in AI, Crypto, and Technology with expert analysis.
- Top 10 AI Stocks - Leading AI companies
- Top 10 Crypto Stocks - Blockchain leaders
- Top 10 Tech Stocks - Tech giants

