
 Rallies 23% From June Bottom — Will $80 Resistance Hold the Line?")
TLDR
- Approximately 600,000 SOL tokens have been transferred to centralized exchanges, suggesting potential selling or hedging activity among traders.
- Technical analyst Ali Charts identified a TD Sequential sell signal on the 4-hour timeframe, with notable resistance at $74.65 and the 200 SMA positioned at $75.
- SOL currently hovers around $74, marking approximately 23% growth from its June bottom of $60.
- The $73 threshold represents a crucial support level — maintaining positions above this price validates the ongoing recovery narrative.
- Market observers are focused on the $80–$82 zone as the next major resistance area, while $50 remains identified as significant support if downside pressure returns.
Solana (SOL) is currently changing hands near $74 following a substantial 23% rebound from its June nadir of $60. This recovery emerged after a pronounced selloff earlier in the month that drove the cryptocurrency significantly beneath a support zone that had previously remained intact for several months.
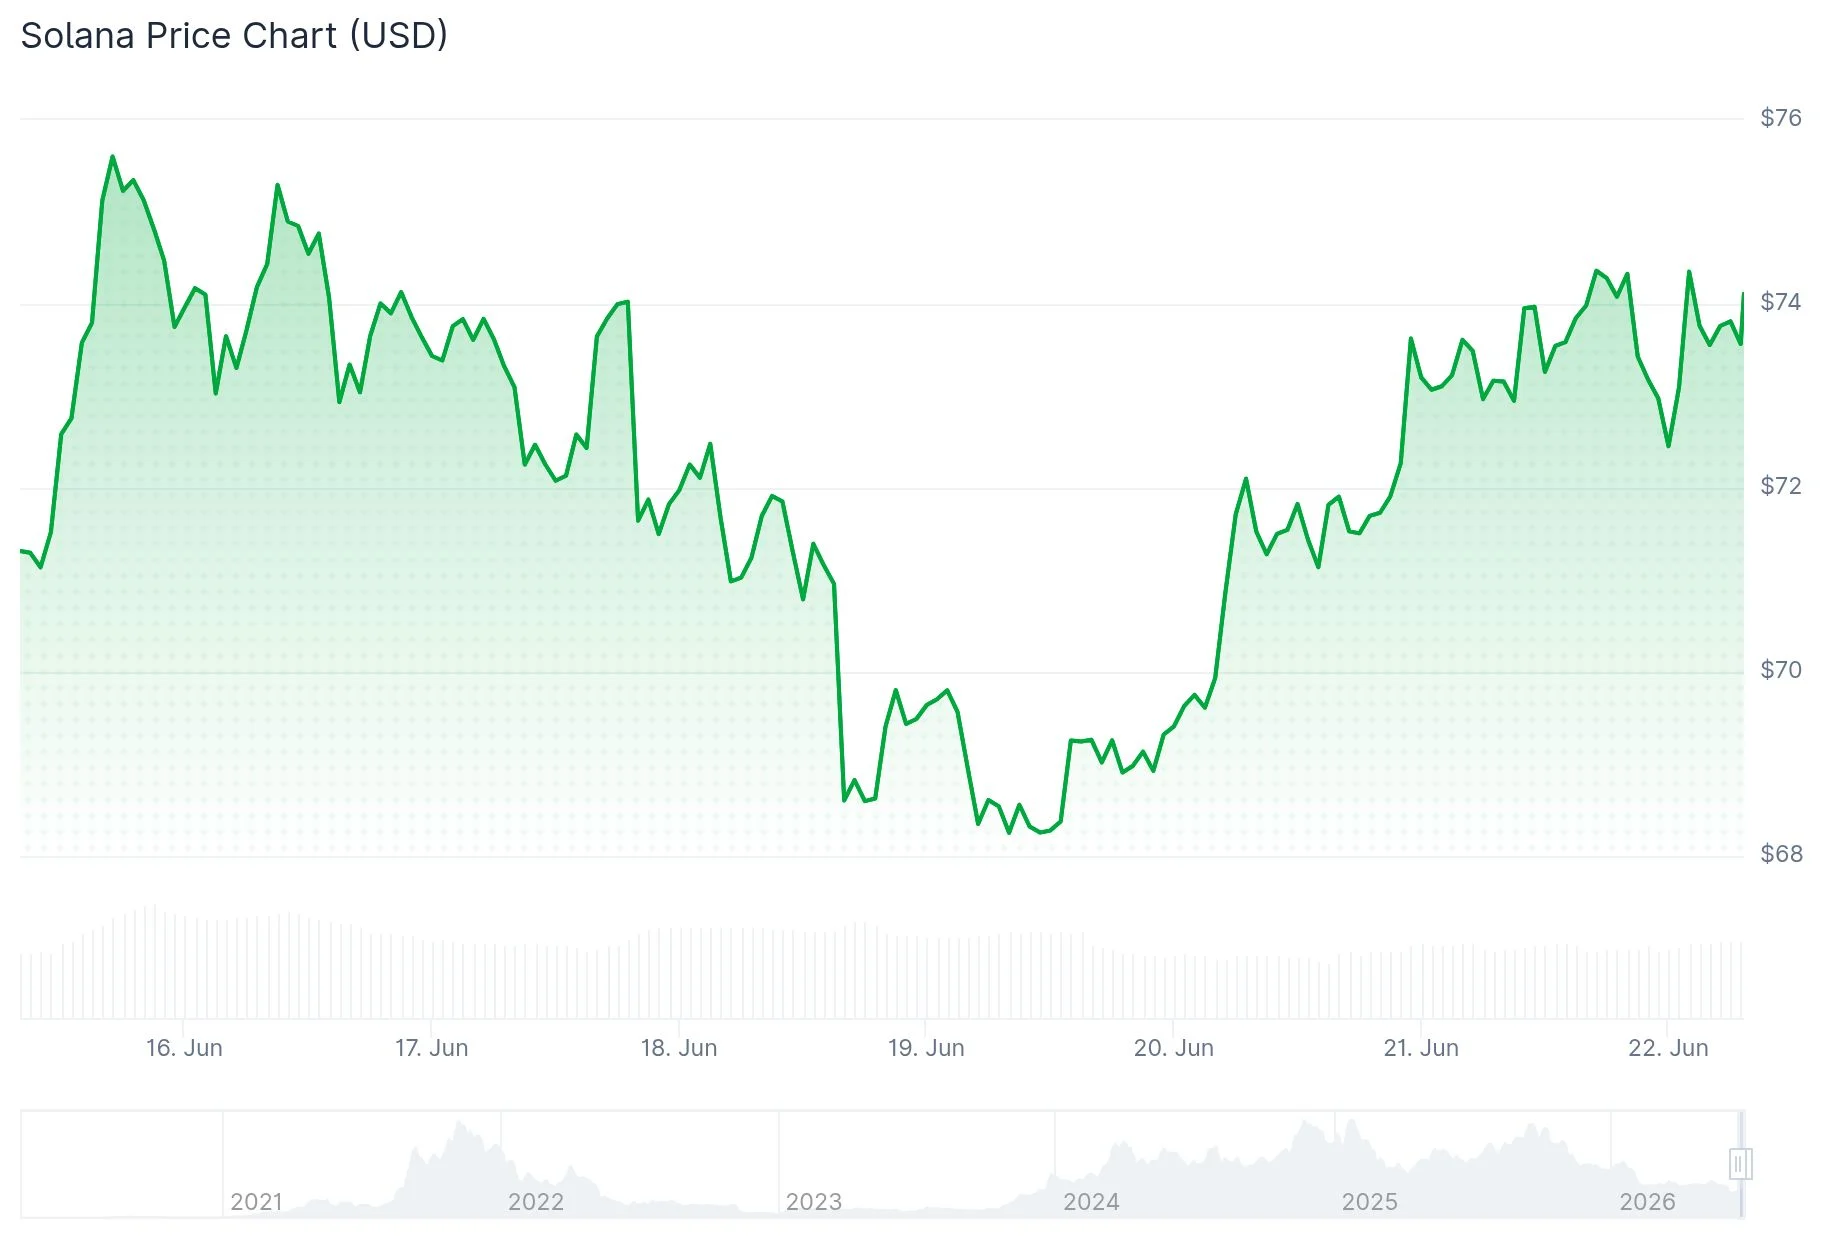
SOL’s daily trading volume stands at $1.89 billion, while its market capitalization reaches $42.96 billion. The digital asset recorded a 3.08% increase over the past 24-hour period.
Cryptocurrency analyst Ali Charts observed on X that after a TD Sequential buy signal triggered last Friday, SOL advanced 8.40% from $68.46 to reach a peak of $74.27. Nevertheless, Ali Charts also pointed out that a sell signal has now materialized on the 4-hour chart, with price action encountering resistance at $74.65. This level corresponds with the 4-hour 200 SMA at $75, creating what Ali Charts characterized as a “highly concentrated technical ceiling.” A retracement from this area could potentially target $71, with an extended decline possibly revisiting $68.46.
Meanwhile, approximately 600,000 SOL tokens have recently been deposited into centralized exchanges, based on Ali Charts’ blockchain data analysis. Substantial inflow surges of this magnitude typically indicate that holders may be positioning to liquidate or establish hedge positions, potentially generating near-term downward pressure on prices.
Critical Price Levels Under Market Scrutiny
Throughout the February-May period, $73 functioned as Solana’s primary support threshold. When the price breached this level downward in June, it transformed into resistance. A daily close reclaiming territory above $74 would indicate the June decline was a false breakdown. Inability to sustain these levels could redirect price action toward $60.

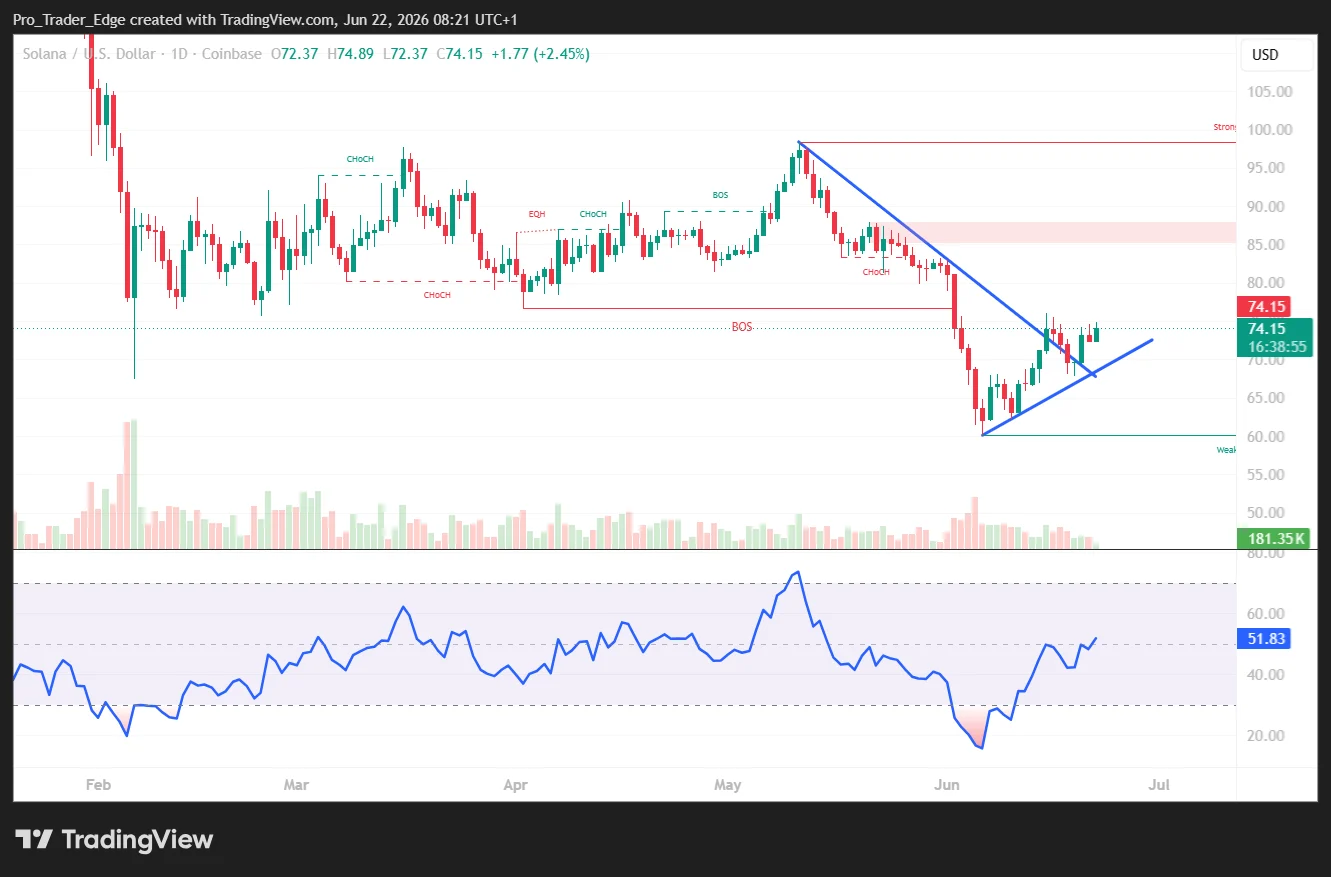
The RSI indicator plummeted to approximately 21 during the June correction, representing a deeply oversold condition. It has subsequently rebounded to 48.45, with its signal line positioned at 39.77. Market analysts suggest this configuration could foreshadow a more decisive directional movement in the near future.
Analyst BitGuru emphasized that SOL bounced from a significant reversal area where selling pressure had previously been dominant. Purchasing interest has subsequently emerged and stabilized price movement, which BitGuru interprets as behavior consistent with accumulation rather than the initiation of an extended bearish trend.
Analyst Altcoin Sherpa has advocated for a cautious approach, stating SOL remains “trash on high time frames” until it demonstrates a structural transformation. He is awaiting a definitive reclaim of $77 before contemplating long position entries.
Overhead Resistance and Downside Support Zones
The 50-day simple moving average is positioned at $79.85, a level that has tracked Solana’s trajectory since February. Breaking above this threshold would bring $90 into focus as the next target.
Analyst EliZ is tracking the $82–$90 weekly supply zone, characterizing it as transitioning from resistance to support. He maintains a constructive outlook on Solana’s ecosystem but is awaiting broader market momentum for confirmation.
Should the current recovery falter and price action deteriorates below $73, the subsequent area of interest lies in the $67–$68 range. A daily close beneath $60 would completely invalidate the bullish recovery scenario, with $50 identified as a major support level in deeper correction scenarios.
SOL is presently challenging resistance near $74.65, with the 4-hour sell signal and exchange deposit activity suggesting potential near-term consolidation before the next significant directional movement materializes.
Get 3 Free Stock Ebooks
Discover top-performing stocks in AI, Crypto, and Technology with expert analysis.
- Top 10 AI Stocks - Leading AI companies
- Top 10 Crypto Stocks - Blockchain leaders
- Top 10 Tech Stocks - Tech giants

