



Key Takeaways
- XRP was changing hands near $1.40 as of September 7, maintaining a market capitalization of approximately $89.26 billion
- Technical analyst Dark Defender identifies historical pattern similarities to 2014 and 2017 rallies, projecting a potential target of $18.23
- Weekly spot XRP ETF inflows declined to $18.96 million in the week concluding September 4, a significant drop from the previous week’s $110.49 million
- The U.S. Senate will conduct a procedural vote on the CLARITY Act September 15, immediately preceding the Federal Reserve’s monetary policy announcement
- Technical resistance levels are established at $1.50–$1.55, while support zones exist at $1.35–$1.31
As September 2026 began, XRP maintained price levels around $1.40, continuing to digest gains from August’s rally that temporarily elevated the token toward $1.70. The subsequent retracement and consolidation phase has traders questioning whether sufficient momentum remains to fuel another upward leg.
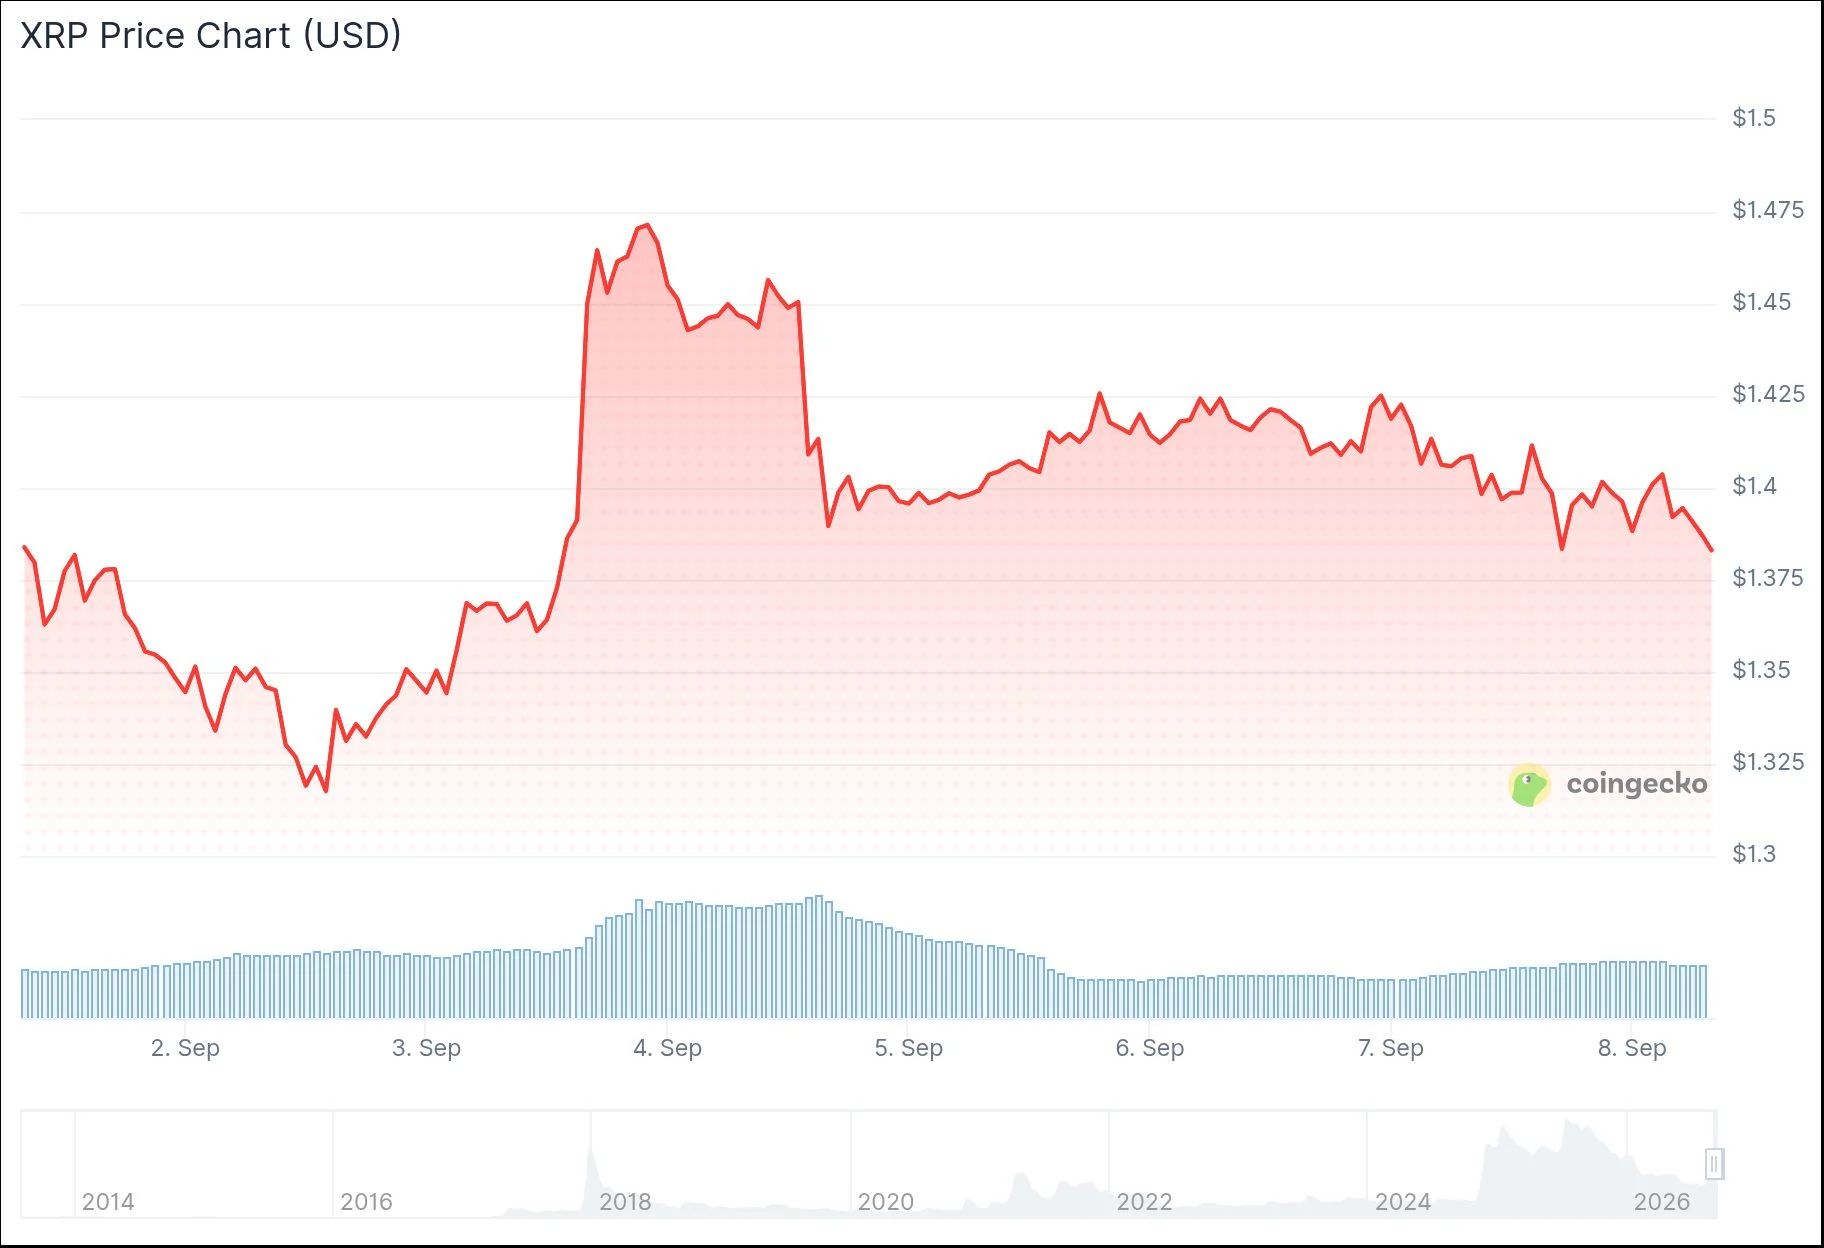
Trading activity on September 7 saw XRP reach an intraday peak of $1.43 before touching a low of $1.38. According to CoinGecko data, the token’s market capitalization stood at $89.26 billion, accompanied by approximately $1.46 billion in daily trading volume. This represents a substantial decline from the $4.17 billion volume recorded on September 4.
From a technical perspective, XRP has successfully escaped a short-duration descending channel pattern that developed following the August rally. Despite this breakout, the price action has yet to generate sustained upward momentum. Current consolidation is occurring marginally above the 20-day simple moving average positioned at $1.3954.
Additional moving average indicators show the 50-day SMA at $1.1916, the 100-day at $1.1588, and the 200-day at $1.2739—all substantially below current trading levels, illustrating the magnitude of XRP’s recent recovery phase.
On the social platform X, cryptocurrency analyst Dark Defender shared a weekly chart analysis revealing XRP trading above several significant long-term exponential moving averages. His assessment suggests the current technical structure resembles formations that preceded major rallies in 2014 and 2017, identifying what he terms an EMA “Jumping Pattern.”

Dark Defender also highlighted a chart projection he refers to as “The Frog Leap,” targeting approximately $18.23—representing a potential gain of 1,201% from present price levels. His commentary stated: “The Frog Leap for an all-time high is closer than you can ever imagine.” His analysis suggests XRP is positioned for movement regardless of the CLARITY Act outcome.
ETF Capital Flows Remain Positive Despite Deceleration
U.S. spot XRP exchange-traded funds registered $18.96 million in net capital inflows during the week concluded September 4—marking the eighth consecutive week of positive flows. This figure represents a considerable decrease from the preceding week’s $110.49 million. Total cumulative net inflows have reached approximately $1.66 billion.
Meanwhile, CME XRP futures open interest expanded from roughly 284 million XRP to 387 million XRP throughout mid-to-late August, increasing CME’s proportion of total XRP futures market exposure from approximately 10% to 17%.
Critical Policy Events Scheduled for September 15–16
The U.S. Senate has scheduled a procedural vote on the CLARITY Act for September 15. Passage requires a 60-vote threshold. With Republicans controlling 53 Senate seats, at least seven Democratic senators would need to support the measure for advancement.
Former federal prosecutor Mariotti offered a pessimistic assessment, declaring: “CLARITY is dead.” Senator Cynthia Lummis countered this perspective, cautioning that failure to pass the legislation now could delay market structure reform until 2030.
The following day, September 16, brings the Federal Reserve’s monetary policy decision. August employment data showed 162,000 nonfarm payroll additions, with the unemployment rate holding steady at 4.1%.
For the week ending September 4, XRP ETF inflows totaled $18.96 million, bringing cumulative net assets under management to approximately $1.44 billion.
Get 3 Free Stock Ebooks
Discover top-performing stocks in AI, Crypto, and Technology with expert analysis.
- Top 10 AI Stocks - Leading AI companies
- Top 10 Crypto Stocks - Blockchain leaders
- Top 10 Tech Stocks - Tech giants


