
TLDR
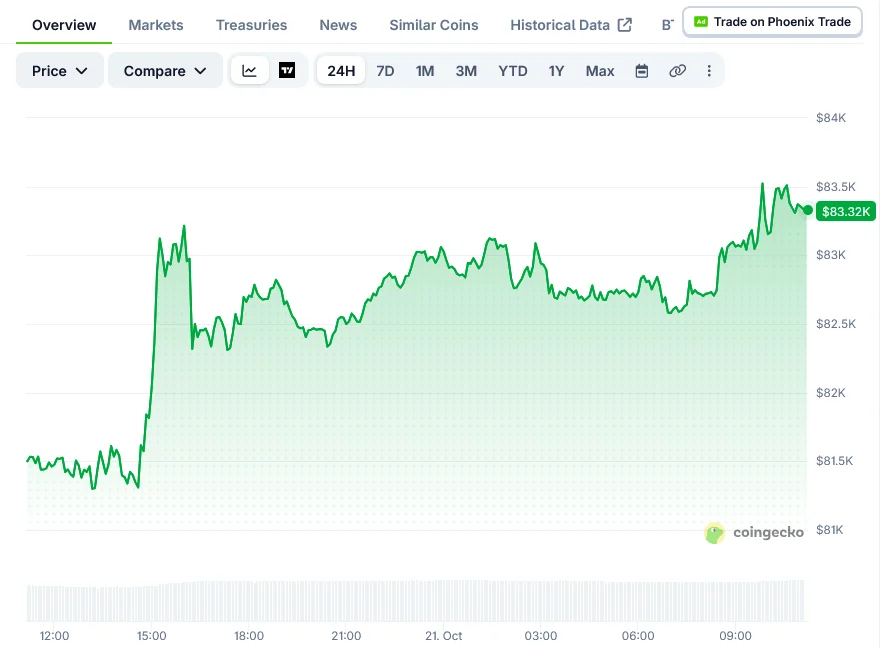
- BTC touched $83,249 on Tuesday before pulling back to the $82,600 range.
- Equity markets advanced while oil declined, with healthcare stocks reaching all-time highs.
- Analyst Ardi identified $84,200 as the critical threshold for breaking the current bearish pattern.
- On-chain data from Glassnode shows reduced sell-side pressure, though ETF and spot buying remains subdued.
- Market observers point to $82,000 as crucial support, warning that $80,000 could be tested if that level fails.
Bitcoin pushed above the $83,000 mark during Tuesday’s session as U.S. equity markets posted solid gains. The cryptocurrency later retreated, settling closer to $82,600.
According to CoinGecko, BTC was trading at $82,601.56, representing a 24-hour increase of 0.8%. The day’s price action saw a low of $81,155.23 and a peak of $83,249.46.
Ethereum posted stronger gains during the same period. ETH changed hands at $2,437.55, marking a 1.6% daily advance after touching $2,471.63.
Equity Markets Climb as Energy Prices Decline
The S&P 500 added 0.70% during Tuesday morning sessions, closing at 7,744.72. The tech-heavy Nasdaq Composite advanced 0.59% to reach 26,585.47.
Healthcare equities posted record levels as crude oil prices weakened. MarketWatch reported that more than 400 components of the S&P 500 finished in positive territory, with optimism surrounding potential peace negotiations contributing to oil’s decline.

The upward movement came after Monday’s technology sector rebound. Last week saw pressure on tech stocks following concerns about CoreWeave’s debt situation and the expenses associated with AI infrastructure development.
Naeem Aslam from Zaye Capital Markets attributed Bitcoin’s upward movement to improved liquidity conditions. He also highlighted reduced market expectations for an imminent Federal Reserve interest rate increase.
However, Aslam cautioned that the recovery doesn’t necessarily signal a sustained trend reversal. He emphasized that elevated inflation, restrictive credit conditions, and ambiguous monetary policy continue to influence appetite for risk assets.
Critical Resistance Level Remains Out of Reach
Analyst Ardi pinpointed $84,200 as the price point Bitcoin must breach to invalidate its current local bearish formation. His assessment came on Oct. 16, following BTC’s bounce from approximately $79,800 during the week.
Ardi indicated he would evaluate long positions after a confirmed break above that threshold. Tuesday’s session high of $83,249.46 placed Bitcoin roughly 1.14% below that target.
A CoinGlass liquidation heatmap referenced in his analysis revealed concentration zones around $83,300–$83,700 and $84,300–$84,700. These represent potential forced closure areas based on leverage positioning, rather than actual liquidation events.
Glassnode’s Oct. 19 assessment noted diminishing selling activity. “The heavy selling behind that slide has faded, but fresh demand has not replaced it,” the analytics firm stated.
During the week ending Oct. 18, ETF outflows decreased to approximately $230 million. Spot cumulative volume delta dropped to negative $83.6 million, compared to negative $67 million the previous week.
Options market participants continued purchasing downside protection. On-chain transaction fees and transfer volume each declined roughly 10%, while the count of active addresses remained relatively stable.
Earlier this month, Lacie Zhang of Bitget Wallet research and Jeff Ko, chief analyst at ViaBTC, identified $82,000 as a significant support threshold. Zhang warned that breaching the $82,000–$82,500 band could accelerate a decline toward $80,000.
Zhang projected an October trading range between $78,000 and $95,000. She stated that Bitcoin would need to reclaim levels above $87,500 for her optimistic forecast to materialize.
Bitcoin currently trades around $82,600, marginally above the $82,000 support zone. Climbing to Ardi’s $84,200 resistance would require an advance of approximately 1.94%.
Get 3 Free Stock Ebooks
Discover top-performing stocks in AI, Crypto, and Technology with expert analysis.
- Top 10 AI Stocks - Leading AI companies
- Top 10 Crypto Stocks - Blockchain leaders
- Top 10 Tech Stocks - Tech giants