



Key Takeaways
- XRP currently hovers between $1.03 and $1.04, with the $1.05 zone transforming from support into a resistance barrier.
- Technical indicators show bearish momentum, with RSI hovering around 38 and approaching oversold conditions.
- The psychologically critical $1.00 mark represents crucial support, coinciding with an important Fibonacci retracement level.
- Large wallet holders continue accumulating tokens while smaller investors retreat from positions.
- Technical analyst Crypto Patel, who accurately predicted a 72% decline from peak levels, now forecasts a potential accumulation range of $0.65 to $0.85.
XRP currently changes hands around $1.03 as of Friday, maintaining a precarious position just above the crucial $1.00 psychological threshold. The digital asset faces mounting downward pressure following its slide beneath the $1.05 support area, which has since transformed into a resistance ceiling.
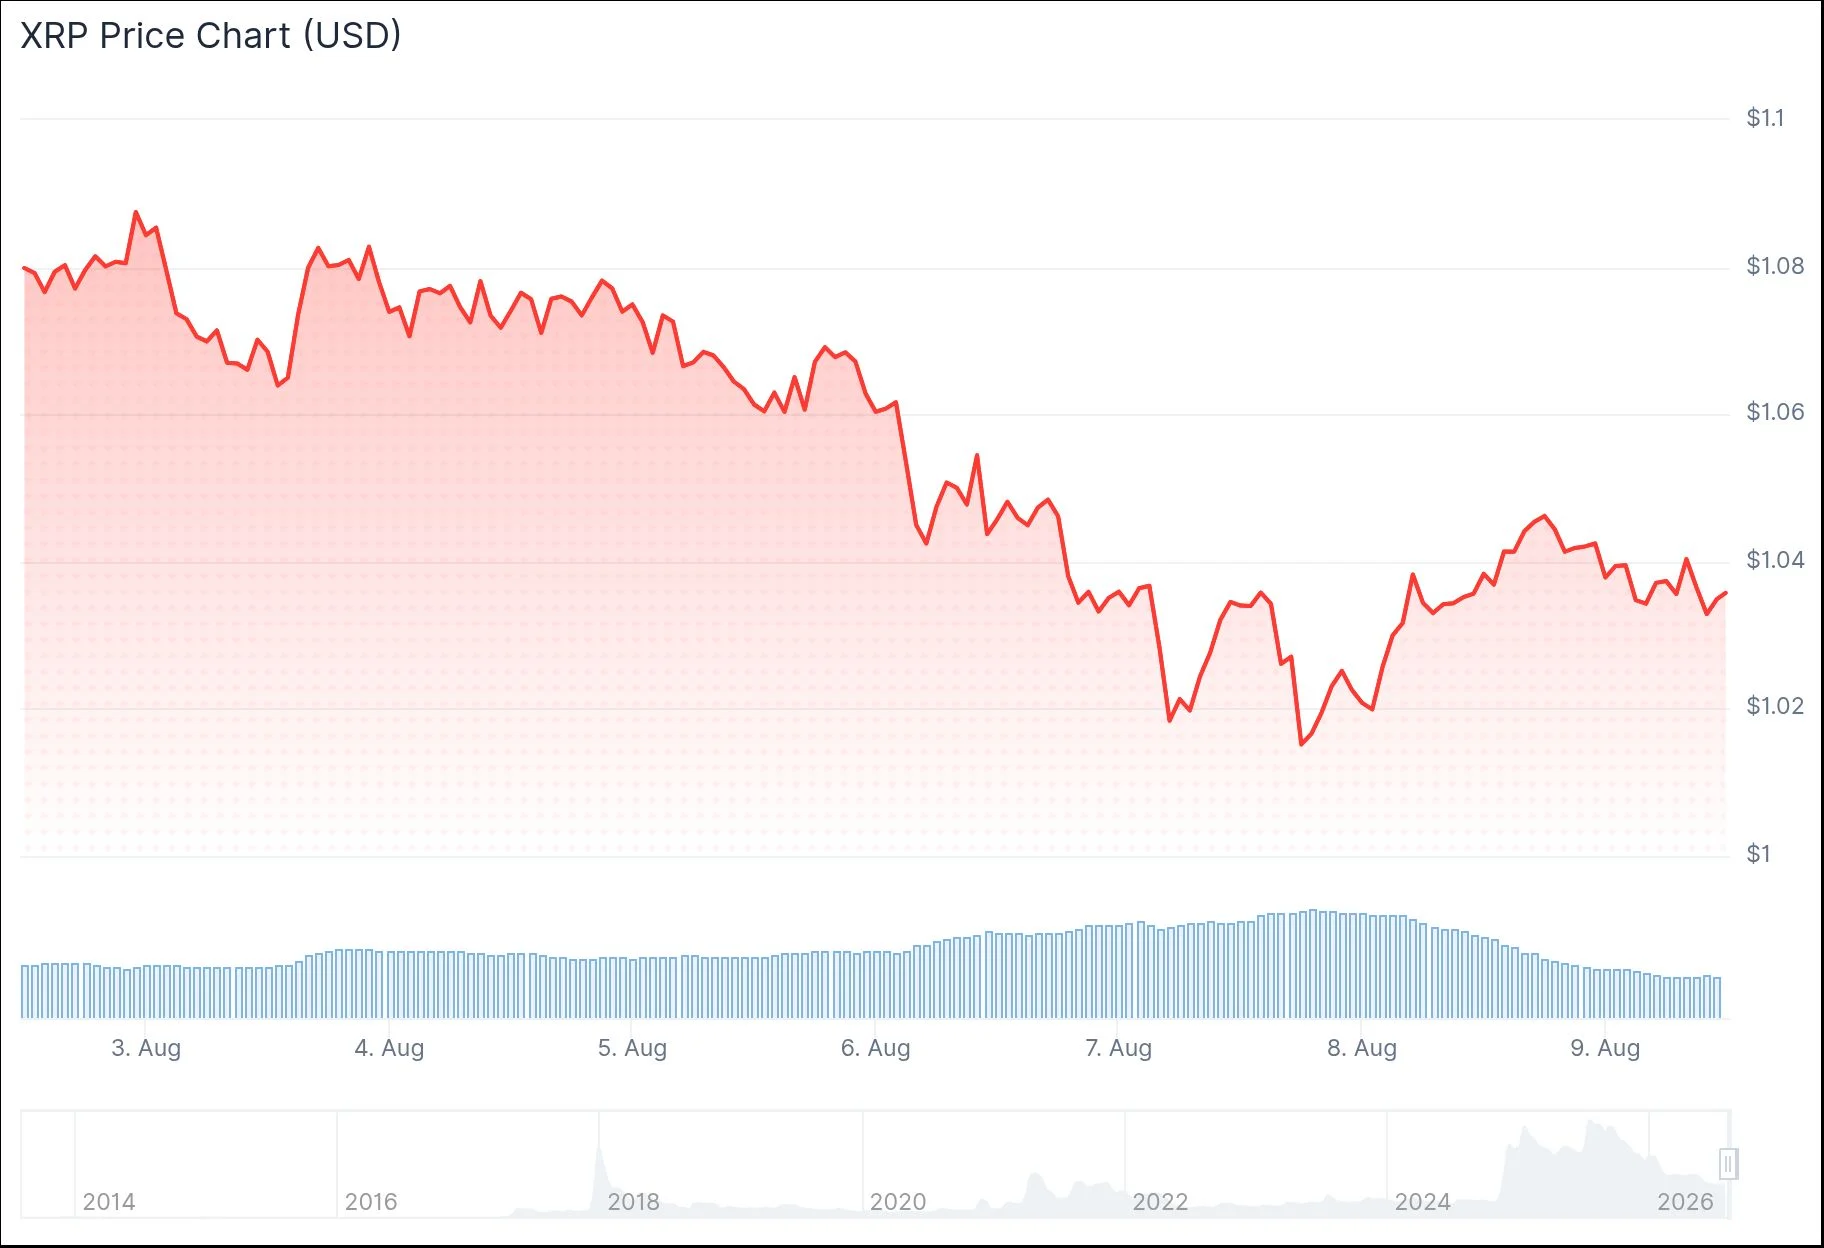
Recent trading sessions saw XRP register its weakest daily closing price of 2026 at approximately $1.02. This low arrived following a breakdown through an upward-sloping support trendline and a retest of June’s bottom levels, strengthening the bearish pattern that has dominated for multiple weeks.
Market observer ChartNerdTA highlighted the trendline violation on July 31, noting persistent rejections at both the 20-day and 50-day exponential moving averages alongside multiple unsuccessful efforts to break through the $1.16 to $1.24 resistance band. According to the analyst, any bounce will likely prove temporary without a decisive move above these technical barriers.
Meanwhile, a TradingView analyst spotted a bearish Break of Structure formation after XRP surrendered the $1.0473 swing low. The 21-period EMA positioned near $1.0527 and the 55-period EMA around $1.0669 now function as overhead barriers. A four-hour candle close surpassing the 55 EMA would be required to shift the technical picture.
The Critical Importance of $1.00 Support
Market analyst Rocksorgate characterized the $1.00 threshold as among XRP’s most significant long-term support foundations. This level corresponds with the 0.618 Fibonacci retracement measured from the token’s extended multi-year rally.

“Should $1.00 fail decisively with substantial volume,” Rocksorgate noted, “the constructive market framework collapses entirely.”
The 50-day EMA rests at $1.11, converging with the SuperTrend indicator. The 100-day EMA stands at $1.19, while the 200-day EMA marks $1.39. Each of these moving averages trades above current prices, creating stacked resistance levels.
The Relative Strength Index currently registers between 37 and 38, while the MACD indicator persists in bearish territory beneath its signal line. Virtually every significant moving average spanning from the 10-period through the 200-period EMA broadcasts a sell signal.
Large Holders Accumulate During Price Weakness
Contrary to the prevailing selling momentum, major wallets continue building positions. Addresses containing between 100 million and 1 billion XRP tokens now control 11.79% of circulating supply, climbing from 11.65% one day earlier, based on Santiment data. Exchange holdings simultaneously decrease, indicating major players are transferring assets into cold storage.
Crypto Patel, a prominent technical strategist, shared on August 8 that he successfully forecasted XRP’s 72% plunge from its cycle peak back in July 2025 when sentiment remained predominantly optimistic. He currently envisions a macro accumulation window spanning $0.65 to $0.85 and anticipates an additional 20% to 40% decline before any substantial reversal. His extended-term price objectives include $3, $5, $7, and above $10.
The Fear & Greed Index presently shows 29, positioned within Fear territory, representing a modest increase from the previous day’s reading of 25.
Initial support appears near $1.026, with more substantial buying interest expected around $0.99. Analysts have identified the next liquidity destination at $1.015.
Get 3 Free Stock Ebooks
Discover top-performing stocks in AI, Crypto, and Technology with expert analysis.
- Top 10 AI Stocks - Leading AI companies
- Top 10 Crypto Stocks - Blockchain leaders
- Top 10 Tech Stocks - Tech giants


