

TLDR
- XRP declined to approximately $1.20, breaking through critical $1.25 support following intense selling pressure on June 2.
- Former support at $1.25 has now transformed into a resistance barrier, creating challenges for bullish momentum.
- Market participants are monitoring the $1.20–$1.21 zone intensively — failure here may drive XRP down to $1.13–$1.15.
- Several market observers interpret this configuration as a possible bear trap, referencing comparable patterns from 2020, 2023, and 2024.
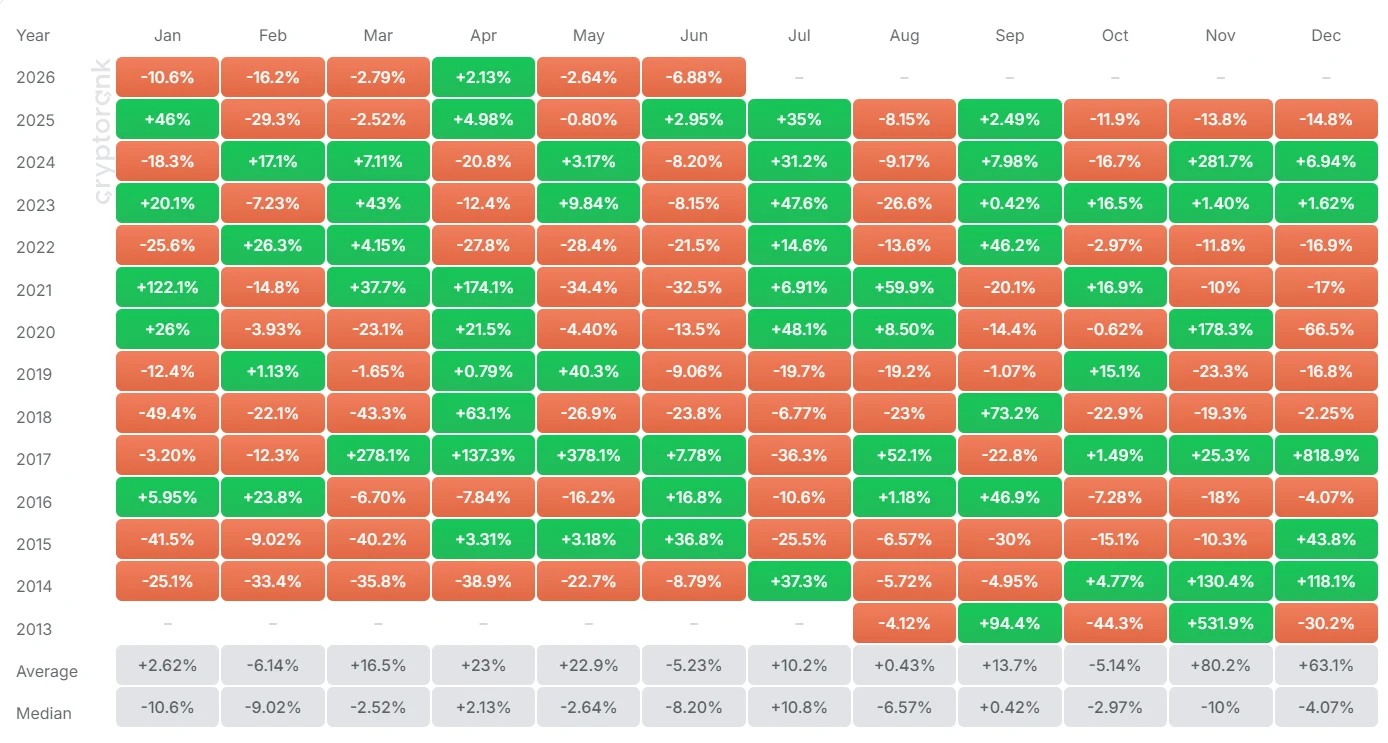
- Historical data shows June typically delivers negative performance for XRP, averaging approximately -5% returns dating back to 2014.
XRP experienced a sharp decline exceeding 5% on June 2, plunging from $1.27 down to an intraday low of $1.18 before stabilizing around the $1.20 mark. This movement wiped out appreciation accumulated since early February and violated a significant support threshold that had been under close observation.
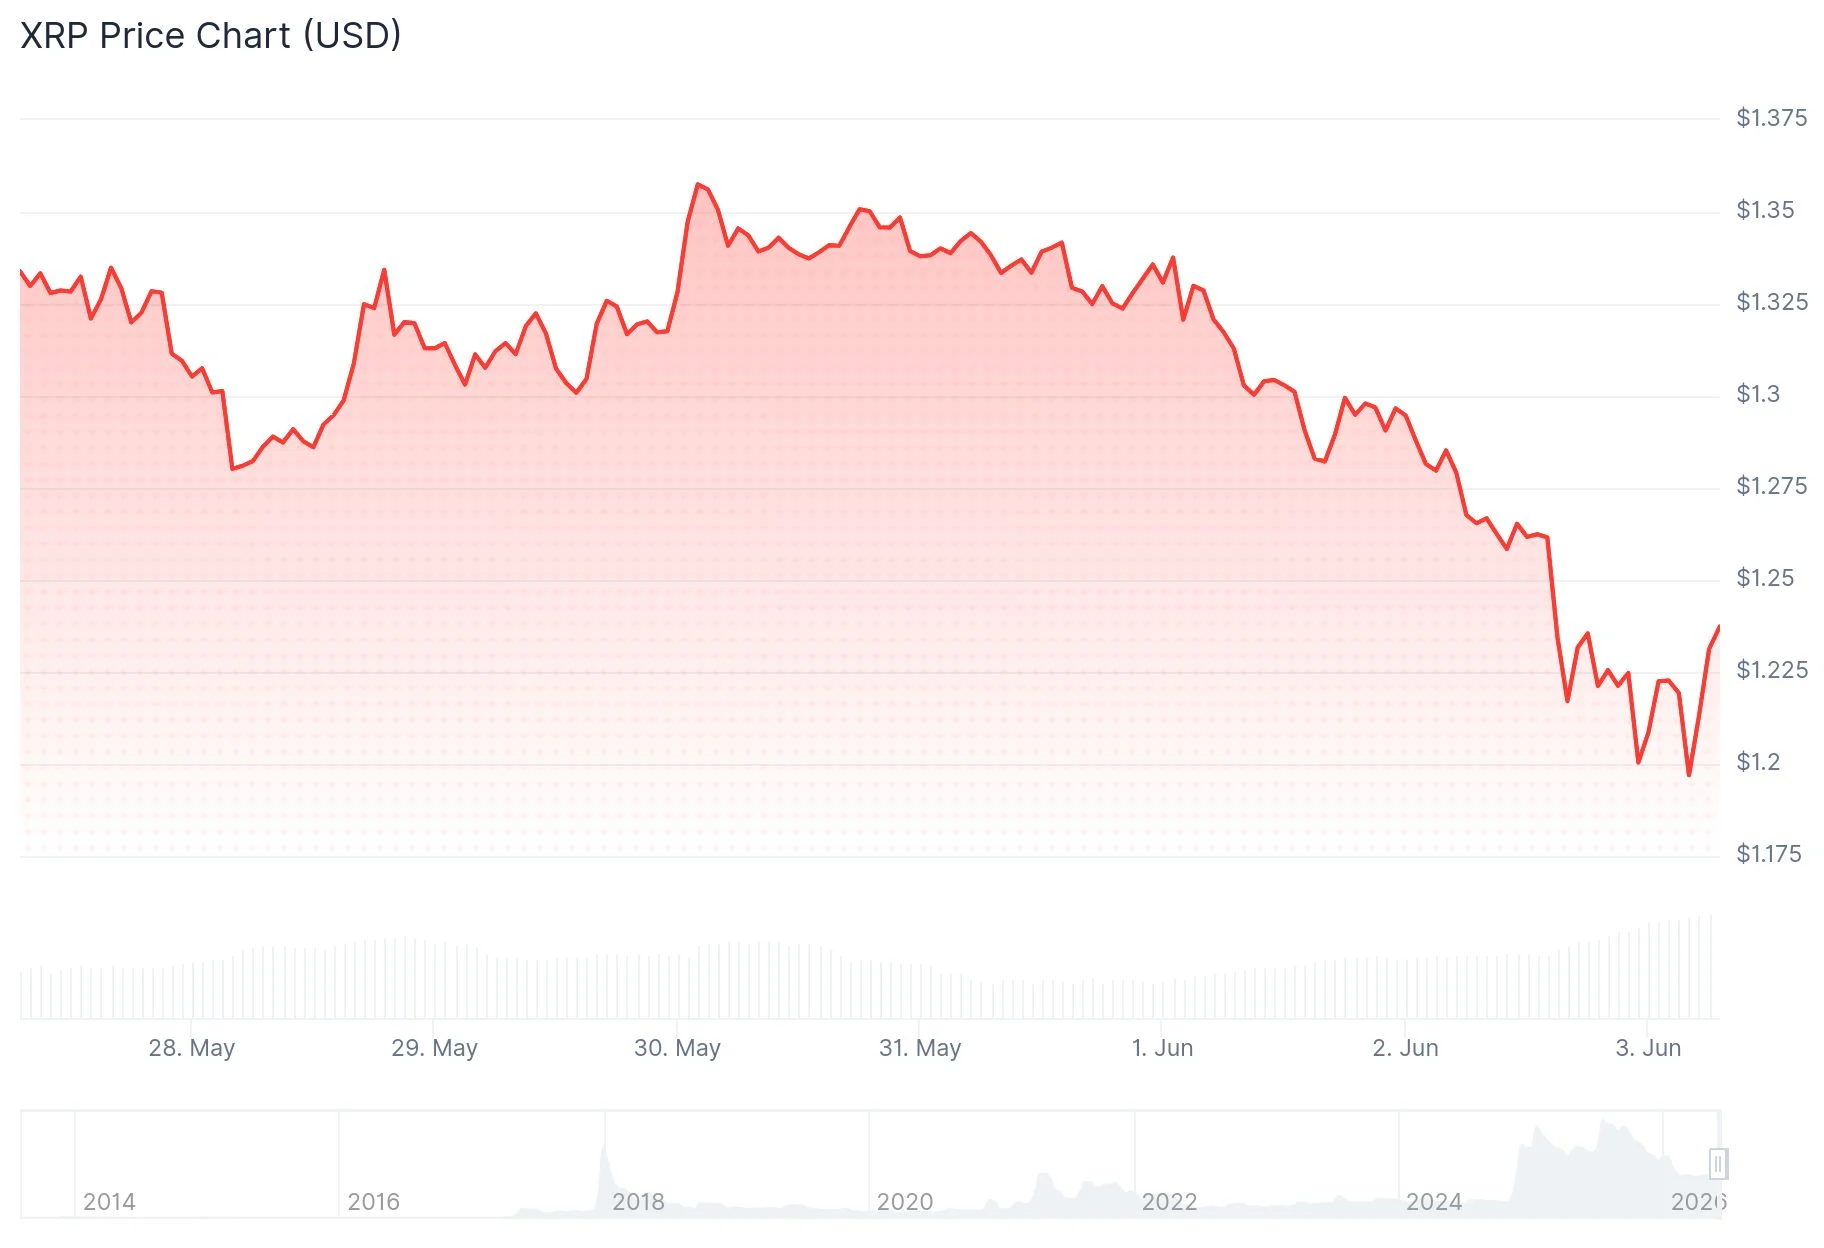
The sharp decline occurred amid broader cryptocurrency market weakness. Trading volume spiked to 205.7 million during the 14:00 UTC trading hour on June 2, coinciding with the breach of the $1.25 support threshold.
Following this breakdown, the $1.25 level has undergone a role reversal, transitioning from support to resistance. Any bullish recovery efforts will now encounter distribution pressure at this price point before momentum can shift favorably.
Market analyst Egrag Crypto observed on X that XRP is currently positioned at or marginally beneath a macro trend line that has provided structural support dating back to 2017. He further highlighted that XRP began June trading just under the 50-month exponential moving average (EMA) — a technical configuration that has historically marked bottoming formations, including instances in 2020, 2023, and 2024.
“If XRP reclaims the 50 EMA and the Macro trend line, this setup could become one of the biggest bear traps of the cycle,” Egrag Crypto wrote.
Crypto analyst Patel shared his perspective on X, identifying what he characterizes as a secondary accumulation window following a 66% retracement. He identified the $1.10–$1.30 range as the present accumulation territory and suggested that if this support fails, the $0.65–$0.85 zone could represent what he termed a “generational entry.” His longer-term price projections include targets of $5, $10, and $15, drawing parallels to a prior accumulation phase that preceded an 835% price surge.

Supply Data Not Helping the Price
Despite certain encouraging blockchain metrics, XRP’s valuation has maintained its downward trajectory. Exchange balances decreased by over 25 million XRP in recent sessions, a development that normally indicates reduced selling pressure. Binance deposit activity also reached 2026 lows. Cryptocurrency investment vehicles recorded approximately $1.42 billion in spot ETF inflows throughout this timeframe.
Yet these factors failed to arrest the price decline. When constructive supply indicators prove ineffective at supporting price, it frequently suggests technical selling momentum has taken control.
Key Levels to Watch
Market participants have now shifted attention to the $1.20–$1.21 area as the most critical support region on current charts. A decisive move below this threshold would likely activate a path toward $1.13–$1.15.
Analyst Kamile Uray identified the crucial support band at $1.26–$1.30, cautioning that failure to maintain this zone could trigger a more substantial retracement toward $0.94–$1.11.
Analyst ChartNerd highlighted a potential bottoming formation between $0.70 and $0.90, derived from historical fractal analysis.
June has consistently proven challenging for XRP performance. Since 2014, the asset has concluded the month with negative returns in eight of twelve instances, posting average losses around -5%. In years when XRP finished May in negative territory, June declines typically intensified. The most severe June contractions occurred in 2018 (-23.8%), 2021 (-34.4%), and 2022 (-21.5%).
XRP was last quoted near the $1.20 level, with market participants closely monitoring whether buying interest can defend this zone heading into the weekly close.
Get 3 Free Stock Ebooks
Discover top-performing stocks in AI, Crypto, and Technology with expert analysis.
- Top 10 AI Stocks - Leading AI companies
- Top 10 Crypto Stocks - Blockchain leaders
- Top 10 Tech Stocks - Tech giants

