

Key Takeaways
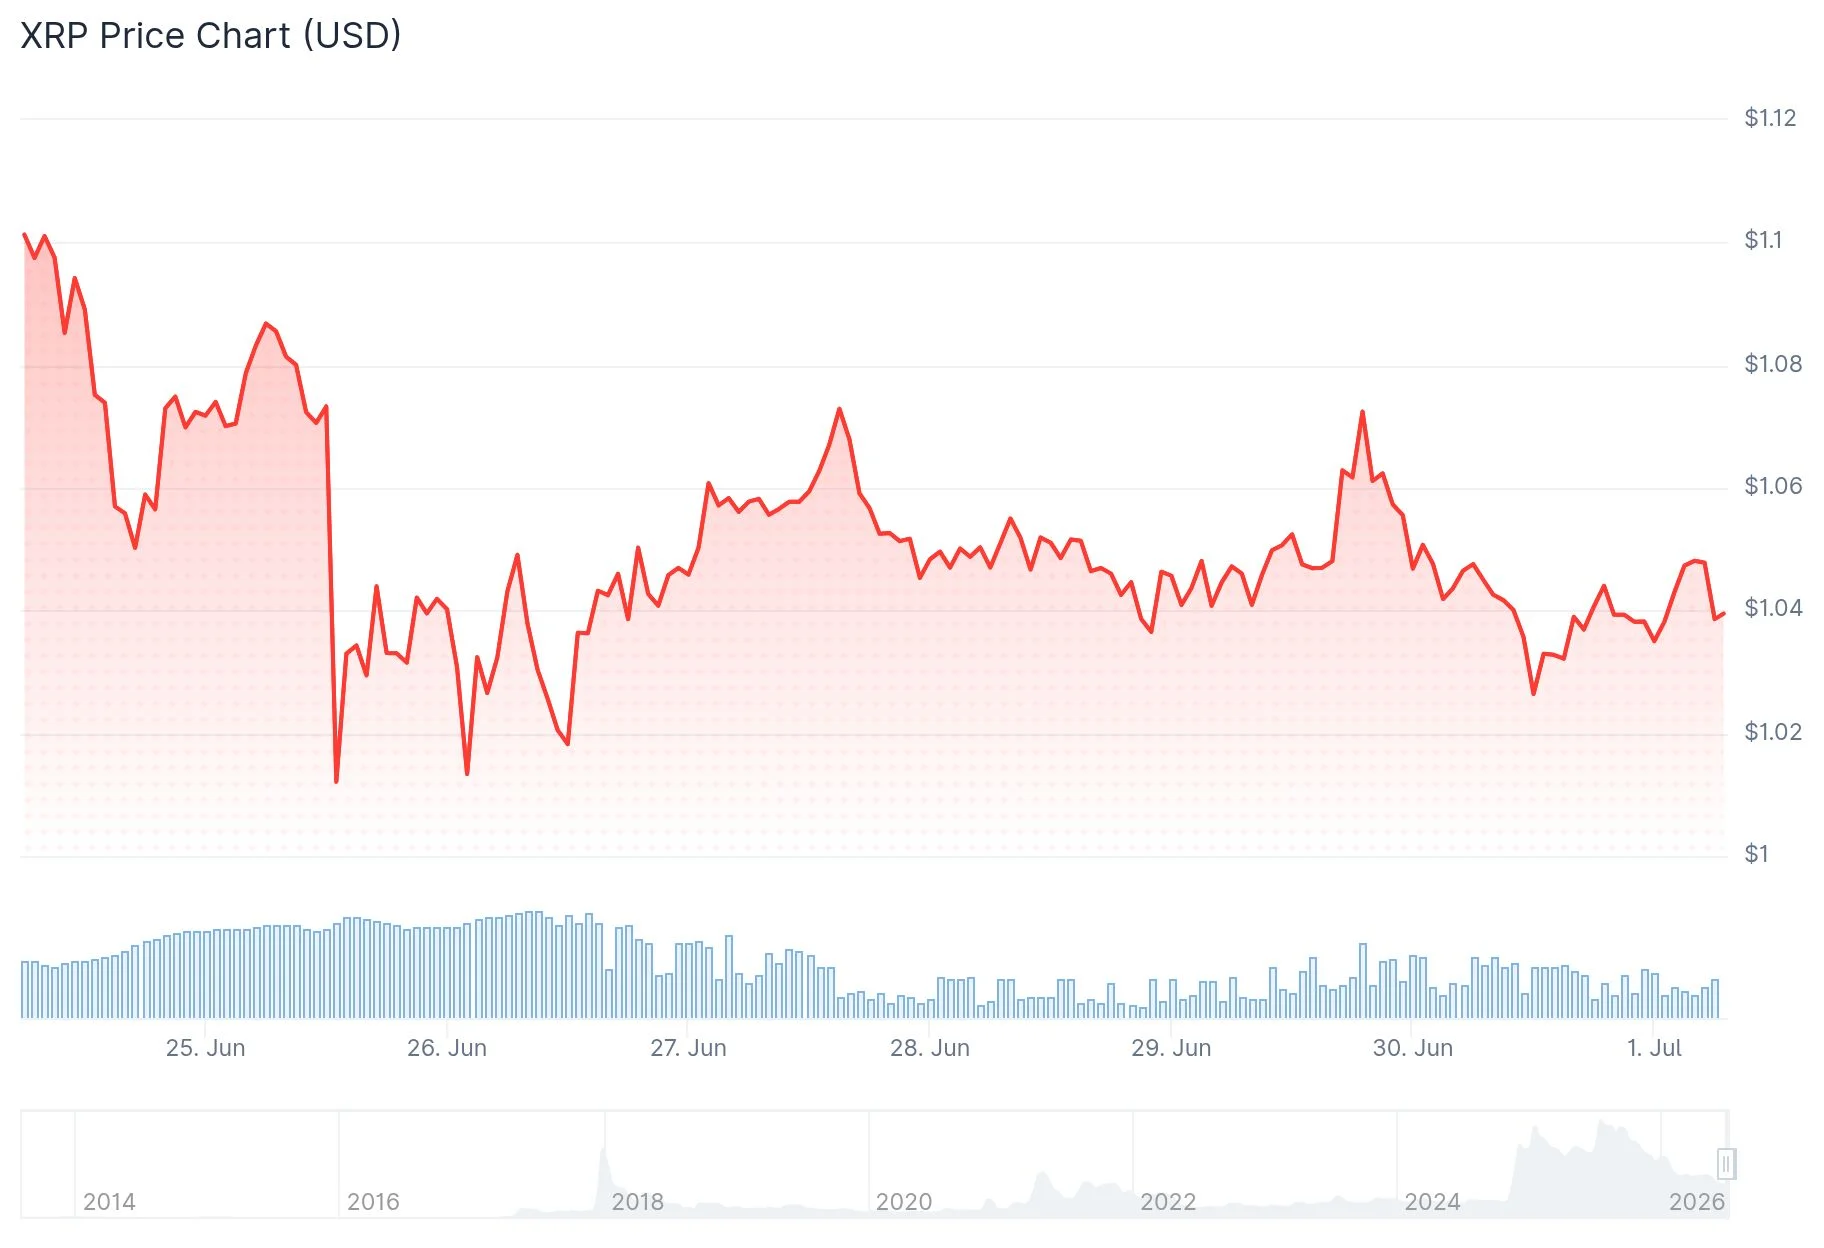
- On June 26, XRP touched $1.009, marking its closest approach to the dollar mark since November 2024
- Despite price weakness, XRP spot ETF inflows maintained positive momentum
- Technical analysis reveals a sustained downtrend originating from July 2025
- Open Interest has found equilibrium around 400 million XRP, indicating reduced speculative fervor
- Bullish divergence on daily timeframes hints at potentially weakening downside momentum near the $1 threshold
On June 26, 2026, XRP descended to $1.009, representing its most significant test of the psychological $1 barrier since November 2024.
This decline occurred despite continued capital inflows into XRP spot exchange-traded funds. Market participants continued accumulating through these investment vehicles while prices deteriorated.
The absorption of circulating XRP supply by ETFs has yet to manifest in upward price momentum given prevailing market dynamics.
General appetite for XRP has contracted over recent months, accompanied by declining speculative engagement.
Technical Analysis Overview
The daily timeframe reveals a persistent downtrend extending back to July 2025. February witnessed a decisive break below the April 2025 swing low at $1.61, cementing the bearish structure.

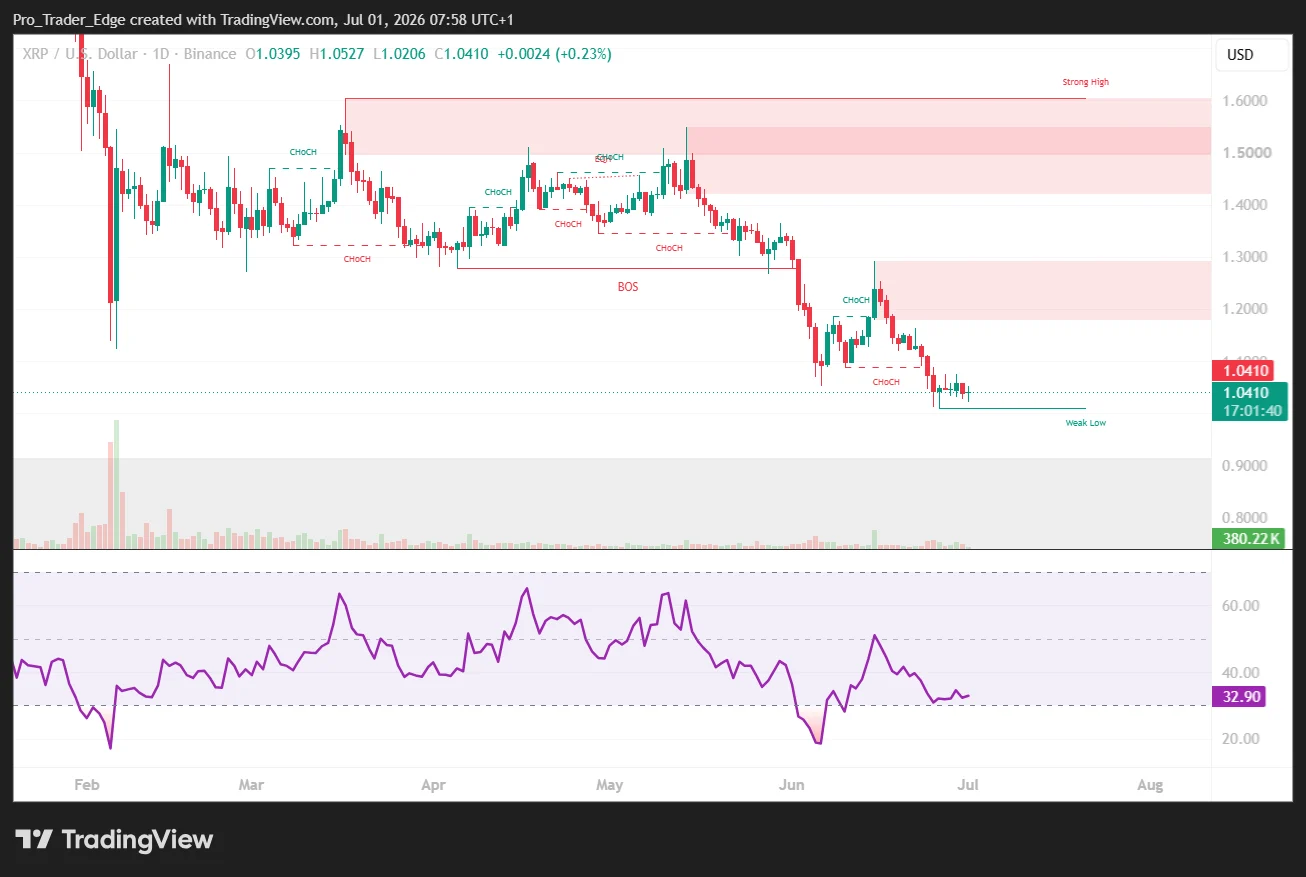
Following this breakdown, XRP consolidated in a sideways range for multiple months. Late May brought aggressive selling that shattered range boundaries and accelerated losses.
A temporary recovery pushed prices toward $1.30 before exhaustion sent XRP back toward the $1.05 region.
Futures market data indicates Open Interest stabilizing around 400 million XRP. The Open Interest Turnover Ratio has maintained levels near 0.71.
According to analyst Arab Chain, market participants should monitor these metrics for sudden expansions. Sharp increases in either Open Interest or turnover typically precede heightened volatility episodes.
Examining the 4-hour chart, XRP rallied to $1.2935 during mid-June. This advance reached the 78.6% Fibonacci retracement near $1.2985 before encountering renewed selling pressure.
Bearish continuation targets rest at $0.975 and $0.854 should downward momentum persist. The probability of XRP trading beneath $1 during July appeared elevated.
Evidence of Underlying Support
An alternative technical perspective presents a different narrative. XRP has repeatedly defended the $0.90 to $1.00 zone, establishing it as a robust support region through multiple retests.
The $1.13 level has transitioned from support to resistance. Recapturing this threshold would indicate renewed bullish conviction.
A bullish divergence pattern on daily charts has persisted for approximately one week. Such formations typically suggest diminishing selling intensity rather than imminent capitulation.
Via social media channels, trader Celal Kucuker projected that XRP would defend current support levels and potentially climb to $10 over the next twelve months, acknowledging significant volatility ahead.
Technical analyst ChartNerd identified a familiar accumulation structure reminiscent of previous bear cycles, referencing historical drawdowns spanning 85% to 96% over 14 to 37 month periods, contrasting with the current 72% correction lasting 11 months.
Presently, the $1.00 level serves as the pivotal battleground. Maintaining this floor preserves opportunities for retesting $1.13 resistance, while failure exposes the $0.87 to $0.90 support zone.
Get 3 Free Stock Ebooks
Discover top-performing stocks in AI, Crypto, and Technology with expert analysis.
- Top 10 AI Stocks - Leading AI companies
- Top 10 Crypto Stocks - Blockchain leaders
- Top 10 Tech Stocks - Tech giants

