
 Crashes Through Critical Support — Analysts Warn of Further Decline")
Key Takeaways
- XRP has plunged through its four-month consolidation floor, currently hovering between $1.16 and $1.18 after a 6%+ daily decline.
- The crucial $1.26–$1.28 support region that remained intact throughout March and April has finally given way.
- All significant moving averages now trade above current price action, with the 200-day EMA positioned above $1.60, signaling sustained bearish momentum.
- Should the $1.14–$1.18 support zone fail, market analysts have identified potential downside objectives at $0.92 and as low as $0.63.
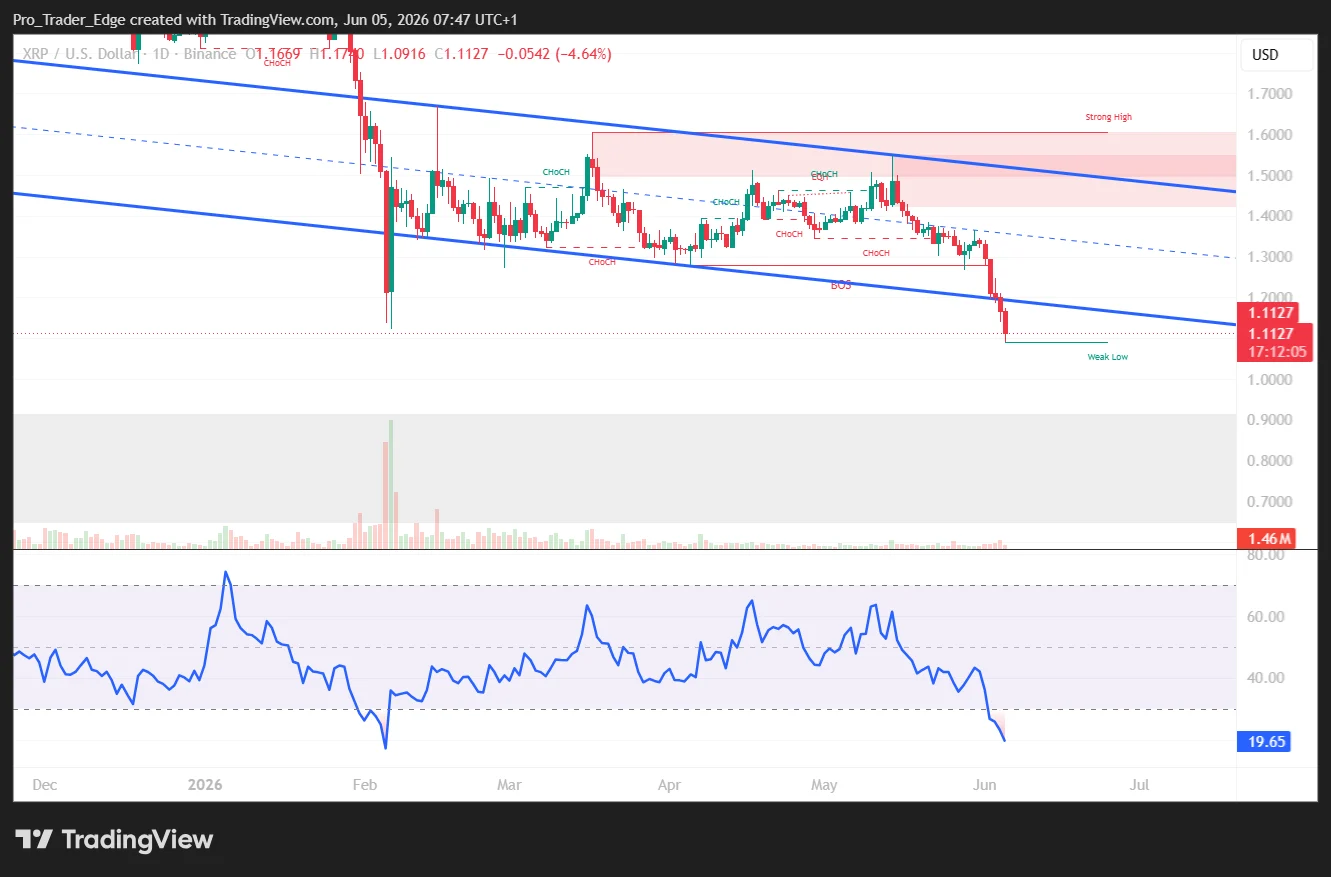
- The RSI indicator has plummeted to approximately 24, entering technically oversold conditions, though broader indicators maintain bearish bias.
XRP has collapsed below a critical consolidation structure that had contained price action for approximately four months. The digital asset currently trades in the $1.16–$1.18 zone, significantly beneath the range bottom that successfully defended against declines throughout the spring.
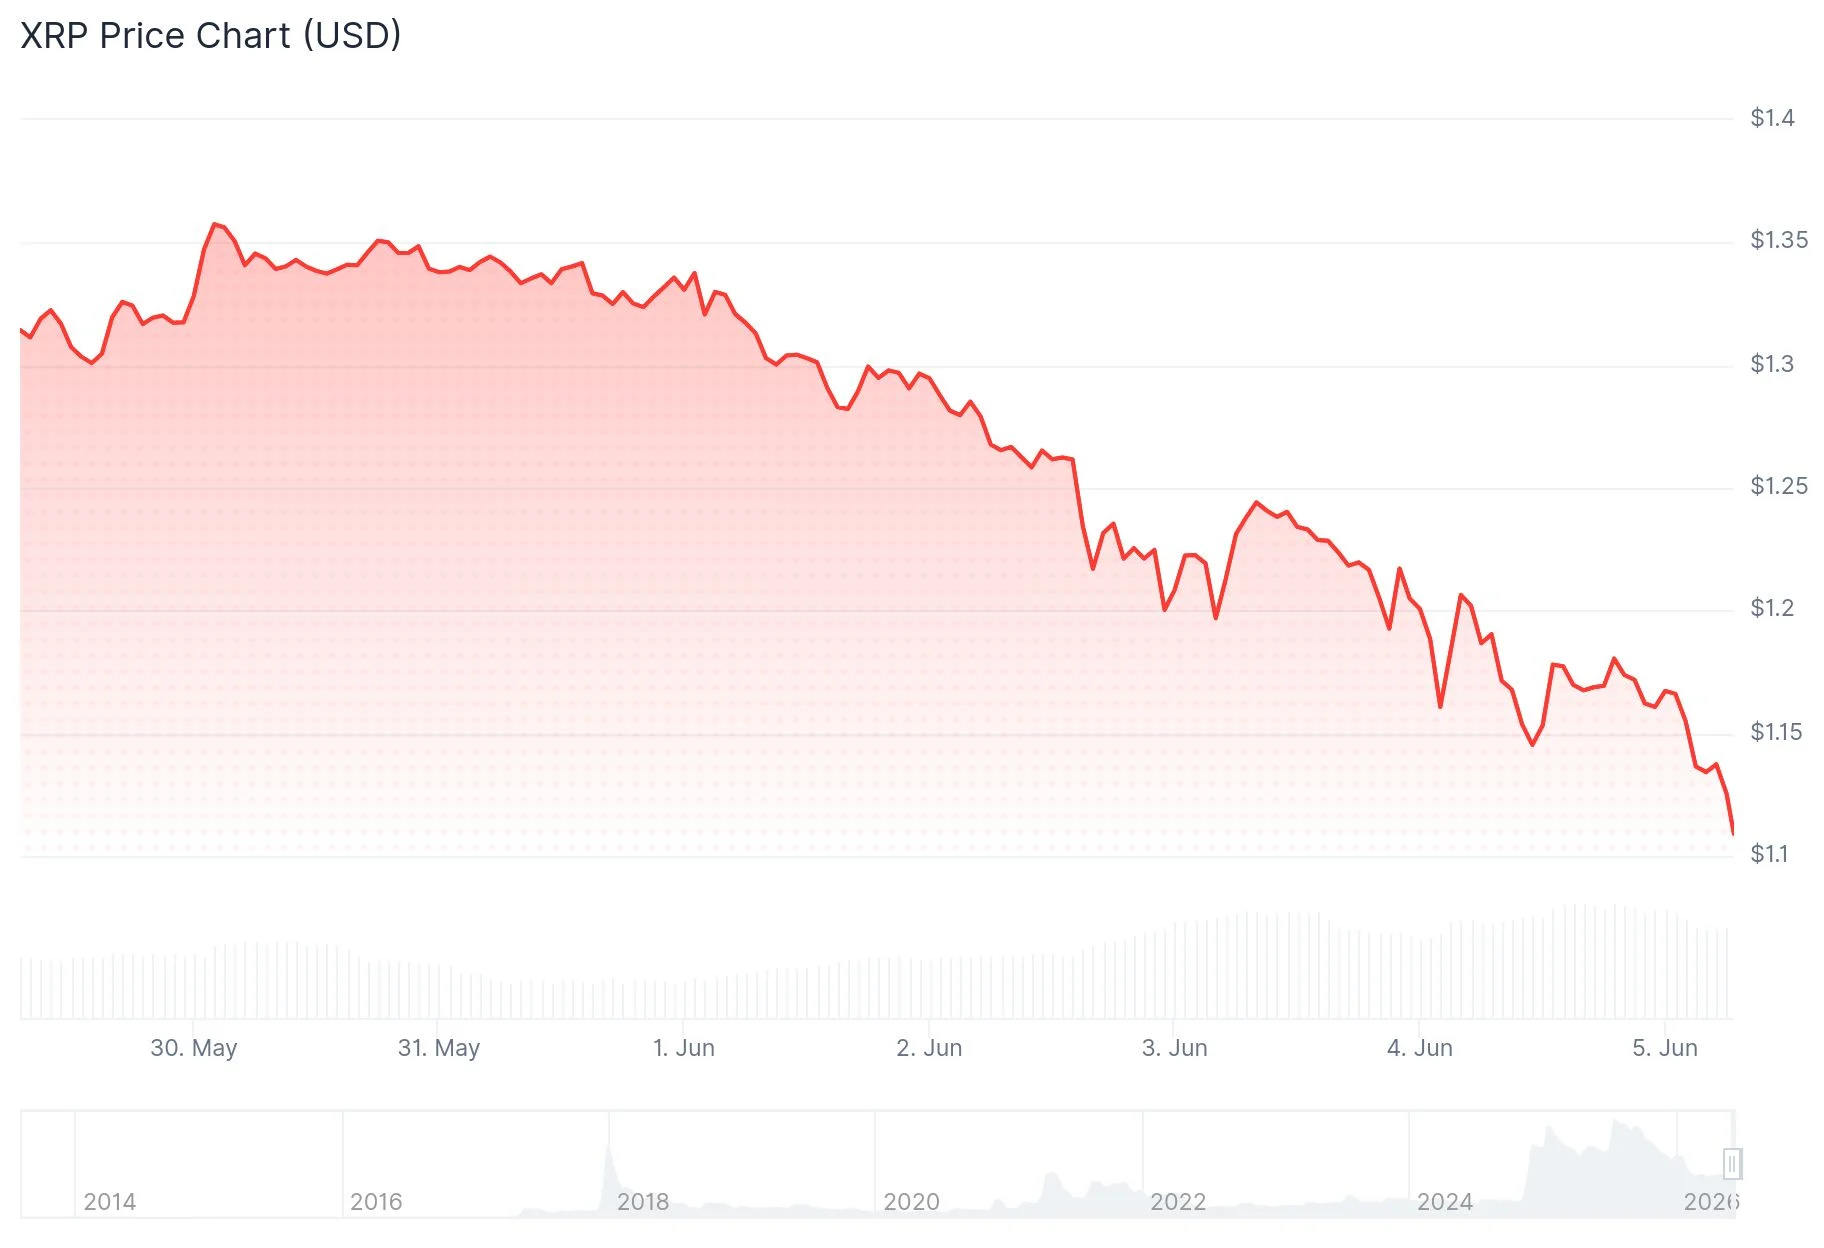
The multi-month consolidation pattern featured an upper boundary around $1.55 with a lower boundary established between $1.26 and $1.28. That critical floor has now been violated, with XRP experiencing approximately 6.1% losses over the past 24 hours.
Cryptocurrency analyst “Guy on the Earth” shared technical analysis via X, displaying XRP testing the $1.279 range low before the subsequent breakdown. His evaluation pinpointed $1.10 as the initial downside objective following the support failure, corresponding with the February wick low.
This projection appears to be materializing in real-time. XRP has decisively broken beneath the range floor, placing the $1.10 target zone in immediate proximity.
Moving Average Configuration Reveals Bearish Structure
The technical landscape presents overwhelmingly negative signals. XRP currently trades beneath virtually every significant moving average. The 10-day EMA hovers around $1.27, while the 50-day EMA positions near $1.36, and the 200-day EMA extends above $1.60. Technical analysts suggest XRP would require a convincing reclaim of the $1.30 threshold accompanied by substantial volume to reverse current sentiment.

TradingView’s comprehensive technical summary reflects a neutral-to-bearish outlook, with moving average indicators delivering the most pronounced sell signals.
Lower Price Targets Under Examination
Analyst Crypto Patel, sharing independent analysis on X, characterized the $1.10–$1.30 range as an active accumulation zone. He suggested that a breakdown from this region could lead to the $0.65–$0.85 range presenting a substantial buying opportunity for long-term investors.
Analyst “Guy on the Earth” identified the most probable bottom formation between $0.75 and $0.95 during an extended breakdown scenario, with an extreme downside case targeting approximately $0.63 — a level that would eliminate the majority of XRP’s appreciation since the final months of 2023.
Additional technical work from trader Blacksea highlighted on X that XRP appears to be replicating the same descending wedge formation that developed in 2024, immediately preceding a significant price movement. Blacksea observed that this pattern historically correlates with aggressive reversals, although current price behavior has not yet validated any breakout scenario.
A Fibonacci retracement calculation near $0.92 aligns with a heavily monitored support corridor between $0.87 and $0.92. Pivot point calculations similarly identify $1.097 as an immediate downside level, with $0.811 representing deeper support infrastructure.
The RSI-14 oscillator has declined to approximately 24.26, penetrating the oversold threshold of 30. The Commodity Channel Index registers around -232. Daily transaction volume continues exceeding $3 billion, indicating sustained market participant engagement with XRP.
At the time of publication, XRP was changing hands at approximately $1.17.
Get 3 Free Stock Ebooks
Discover top-performing stocks in AI, Crypto, and Technology with expert analysis.
- Top 10 AI Stocks - Leading AI companies
- Top 10 Crypto Stocks - Blockchain leaders
- Top 10 Tech Stocks - Tech giants

