



Key Takeaways
- XRP currently sits at $1.13, reflecting a 3.21% decline over the last day, while trading activity fell 43.3% to $1.14 billion.
- Technical expert Egrag Crypto observes the Super Guppy indicator entering compression mode, indicating weakening price momentum.
- Critical support lies within the $0.80–$1.10 corridor; losing this zone could compromise XRP’s long-term technical framework.
- Technical analyst ChartNerd identifies a potential death cross formation between the 20-week EMA and 200-week SMA around $1.20.
- XRP consolidates within a symmetrical triangle pattern, with bullish traders eyeing a potential push toward $2.
As of July 5, 2026, XRP holds a price position of $1.13, representing a 3.21% decrease across the previous 24-hour period. Market activity has contracted significantly, with trading volume declining 43.3% to reach $1.14 billion, per CoinMarketCap statistics. However, the seven-day performance shows an 8.75% appreciation.
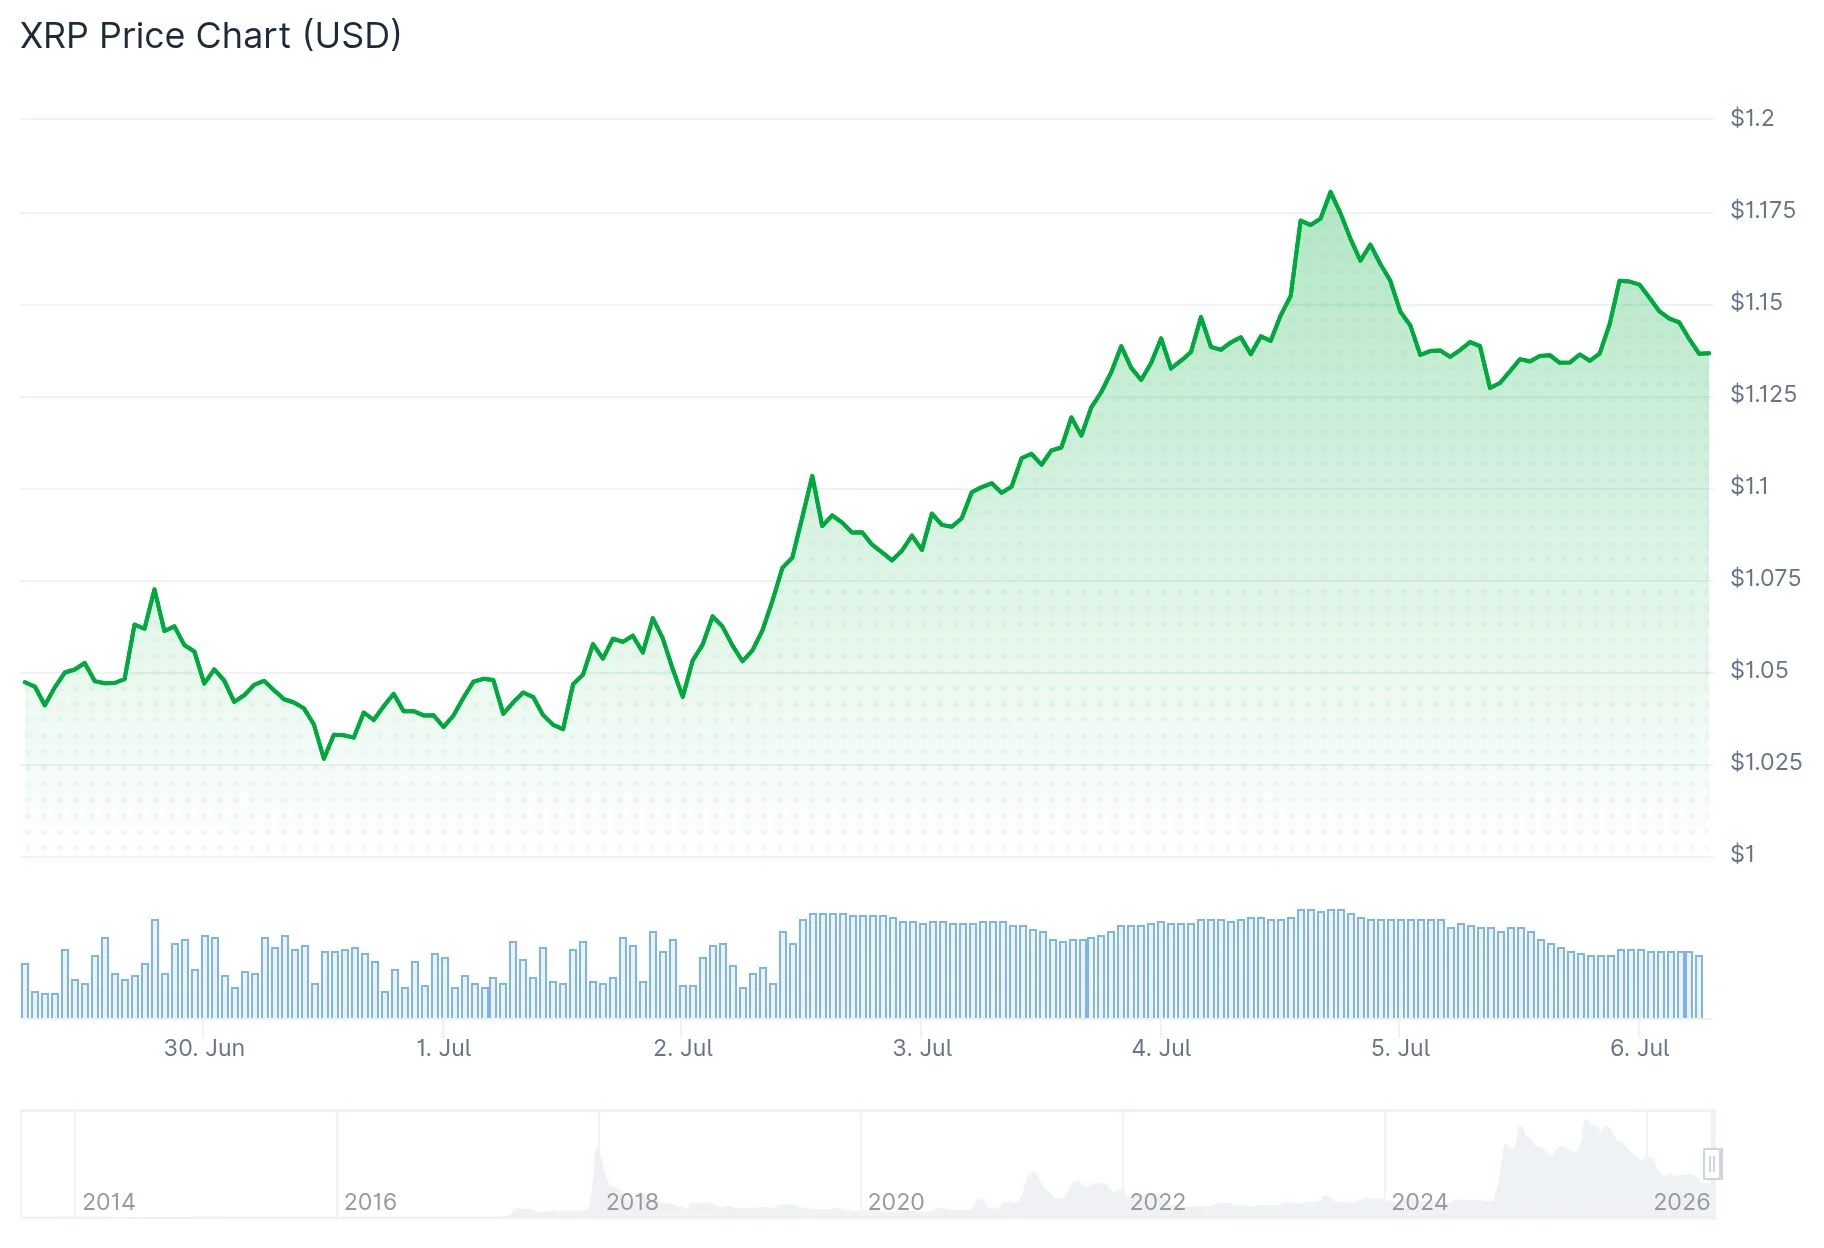
The recent price contraction coincides with technical analysts spotting two significant chart signals. The first indicates diminishing momentum, while the second suggests the possibility of a bearish technical crossing on longer timeframes.
Cryptollica, a market analyst, shared on X platform that XRP currently registers its deepest oversold reading throughout its 13-year trading history. Their statement reads: “This is not where the crowd gets excited. This is where most gives up before the real move begins.” The analyst emphasized that the RSI has reached depths unprecedented in any previous XRP correction cycle, with price action testing fundamental long-term structure following years of resistance and skepticism rather than euphoric rallies.
Well-regarded technical analyst Egrag Crypto drew attention to the Super Guppy indicator displayed on XRP’s weekly timeframe. The indicator has transitioned from robust green expansion phase into a mixed grey compression configuration. This transformation indicates declining momentum strength.
Egrag characterizes this phase as a “macro retest” or “cooldown pattern.” According to his analysis, the $0.80–$1.10 corridor represents the critical support boundary requiring close observation. Maintaining price action within this zone preserves the larger bullish framework.

Super Guppy Price Objectives and Recovery Scenario
Should XRP successfully defend support levels, recover above the red moving average zone, and shift the Guppy indicator back toward green territory, Egrag has outlined multiple upside price objectives. The targets encompass $3.59, a mid-range zone between $6.73–$9.17, $16.36, and an extended cycle projection reaching $53.86.
These represent extended-timeline scenarios. Near-term conditions warrant greater caution.
ChartNerd, another technical analyst, issued a warning that XRP approaches a potential death cross formation on weekly charts. Specifically, the 20-week exponential moving average may soon cross beneath the 200-week simple moving average. The 200-week SMA currently positions itself around $1.20.
ChartNerd referenced similar configurations that emerged during previous bear market phases. During 2022, XRP established a local bottom merely one week following the death cross occurrence. Throughout the extended 2018–2020 bear period, the ultimate bottom materialized six months afterward.
Drawing from these two historical precedents, ChartNerd anticipates a possible cycle bottom forming between June and year-end 2026, with projected price levels of $0.90 or $0.70.
Symmetrical Triangle Pattern Provides Additional Context
Meanwhile, blockchain data provider XRP Update has identified a symmetrical triangle configuration developing on XRP’s price chart. Price action has been narrowing between a downward-sloping resistance boundary and an upward-trending support line throughout recent months.
The triangle pattern now nears its convergence point. This signals the consolidation window is approaching its conclusion.
A decisive breakout above the triangle’s upper boundary, accompanied by substantial volume, would deliver the confirmation signal bullish traders anticipate.
XRP has simultaneously displayed hidden bullish divergence coupled with ascending RSI bottoms. Certain technical observers interpret this as evidence that accumulation pressure is steadily building below current price levels.
The RSI divergence combined with triangle compression collectively suggest a potential advance toward $2. Several market analysts believe sustained momentum beyond that threshold could propel prices into the $3 territory.
As of this writing on July 5, 2026, XRP maintains its $1.13 valuation, with the $1.20 level — corresponding to the 200-week SMA position — serving as the immediate resistance barrier warranting attention.
Get 3 Free Stock Ebooks
Discover top-performing stocks in AI, Crypto, and Technology with expert analysis.
- Top 10 AI Stocks - Leading AI companies
- Top 10 Crypto Stocks - Blockchain leaders
- Top 10 Tech Stocks - Tech giants


