



Key Takeaways
- XRP currently sits at $1.09, reflecting a 0.99% gain over 24 hours, with total market capitalization reaching $68.46 billion
- Technical analyst Bird identified a weekly MACD momentum reset on XRP Dominance charts — the same signal that appeared before two major price rallies
- A classic inverse head-and-shoulders reversal formation is taking shape on daily timeframes, with critical neckline resistance between $1.10–$1.12
- Price action remains beneath the 20, 50, 100, and 200-day simple moving averages, indicating continued bearish pressure
- The Relative Strength Index reads 34.06, nearing oversold conditions and hinting that selling momentum may be exhausting
XRP is currently changing hands at $1.09, maintaining position near an important demand zone while multiple technical formations capture analyst attention. The digital asset has gained 0.99% during the past 24 hours, accompanied by $925.26 million in trading volume and maintaining a $68.46 billion market capitalization.
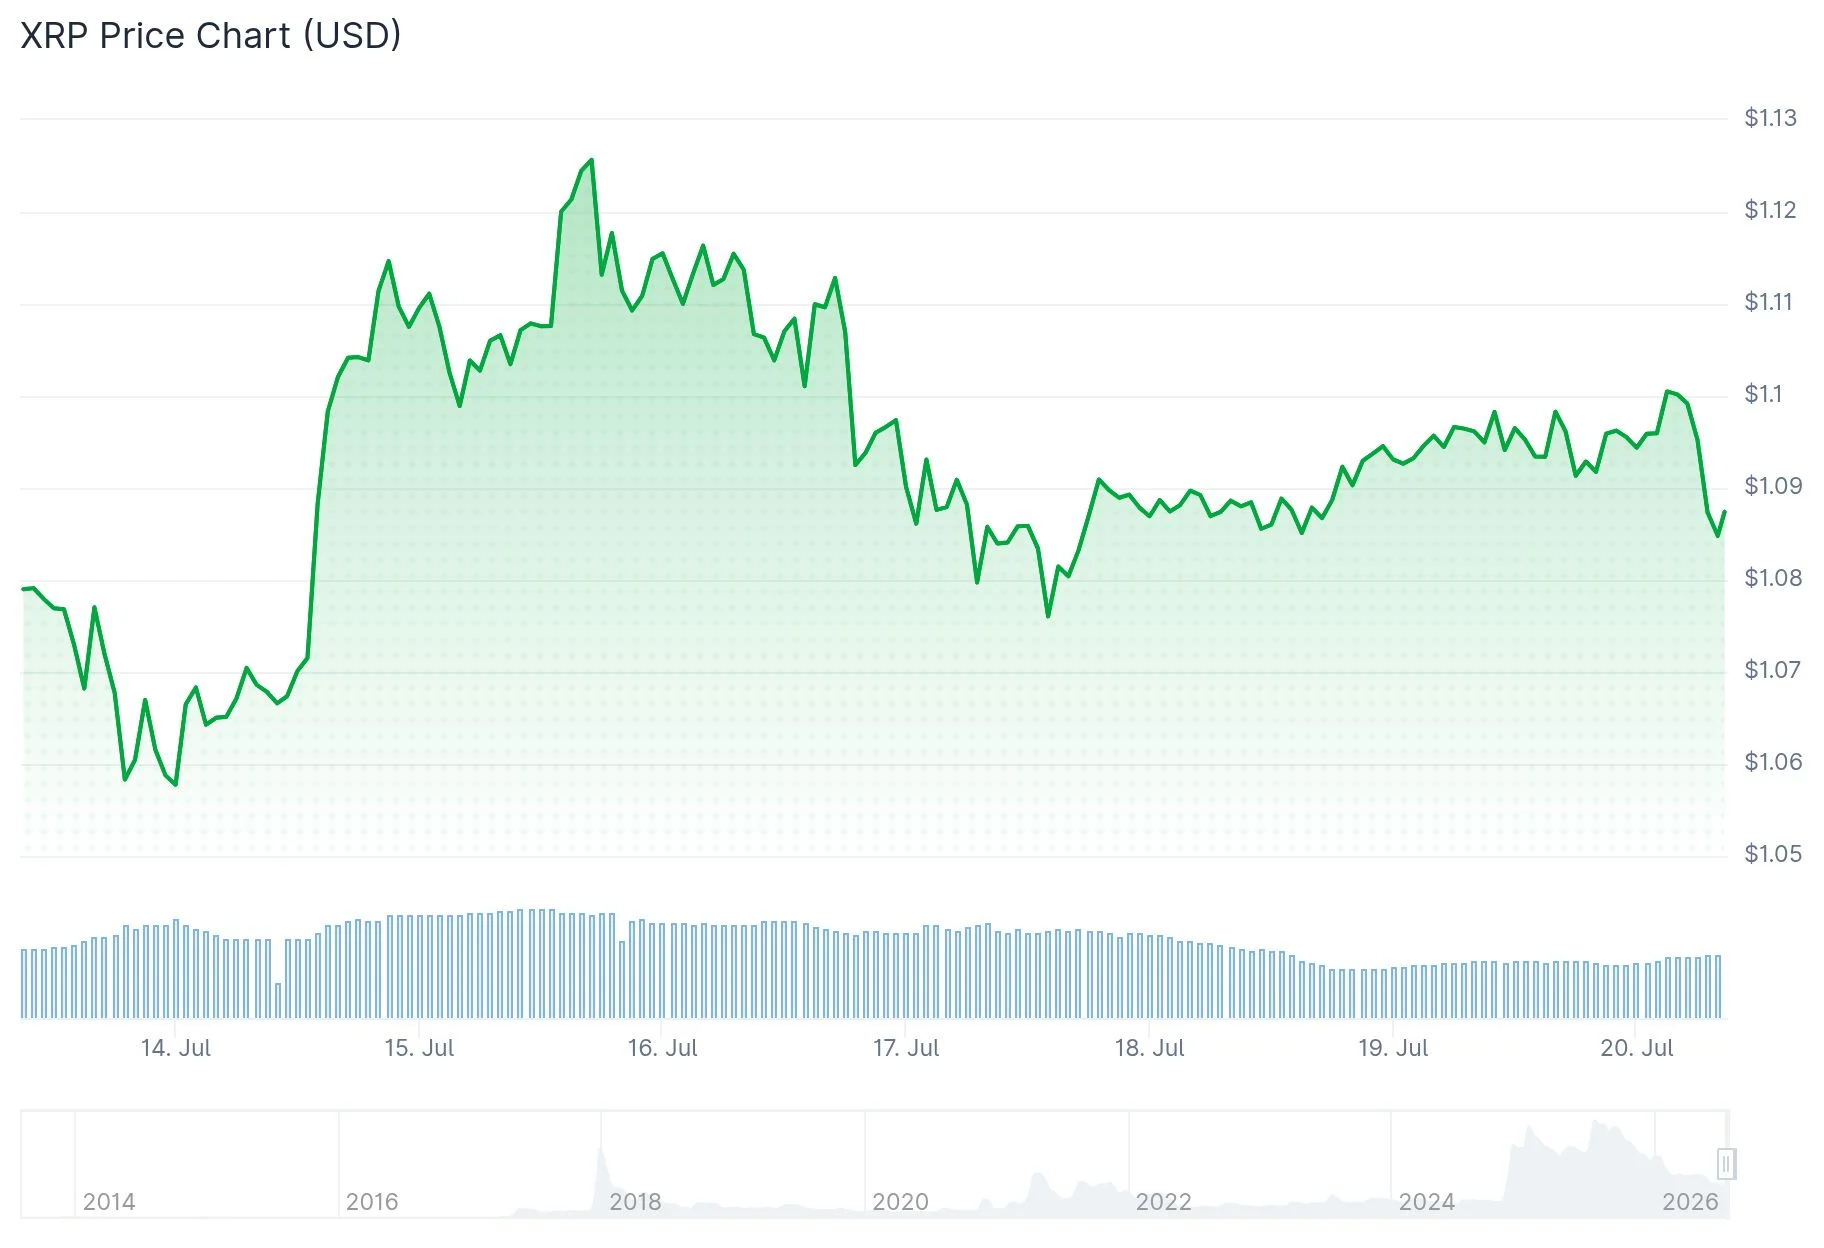
Throughout 2026, the token has predominantly trended downward following its earlier peak above $2. Multiple buyer attempts to establish price stability have emerged, yet overhead resistance zones have consistently prevented meaningful recovery rallies.
On July 19, 2026, cryptocurrency analyst Bird drew attention to the XRP Dominance chart. This metric tracks XRP’s percentage of total cryptocurrency market value instead of absolute price. Bird pinpointed a weekly MACD momentum reset appearing on this chart — a technical signal that has materialized twice previously. Following both prior occurrences, XRP dominance experienced substantial upward movements.
Bird explained that prolonged bearish cycles typically reset momentum oscillators, and when buying pressure resurfaces, the subsequent price action often proves aggressive rather than incremental. He proposed this technical setup might represent the initial stage toward a $27 price objective, while emphasizing that pattern recognition alone doesn’t ensure that destination will be reached.
In a separate assessment, analyst MikybullCrypto published commentary on X characterizing XRP as “the best low-risk play right now” featuring “at least 5x target,” indicating heightened analyst interest in the token’s technical position at present price levels.

Classic Reversal Pattern Takes Shape
Analysis of the daily timeframe reveals a potential inverse head-and-shoulders formation developing. The head formation bottomed approximately between $1.05–$1.07, while the neckline resistance extends across $1.10–$1.12. This zone represents the critical validation area. A convincing daily close exceeding $1.12 would validate the bullish reversal thesis.
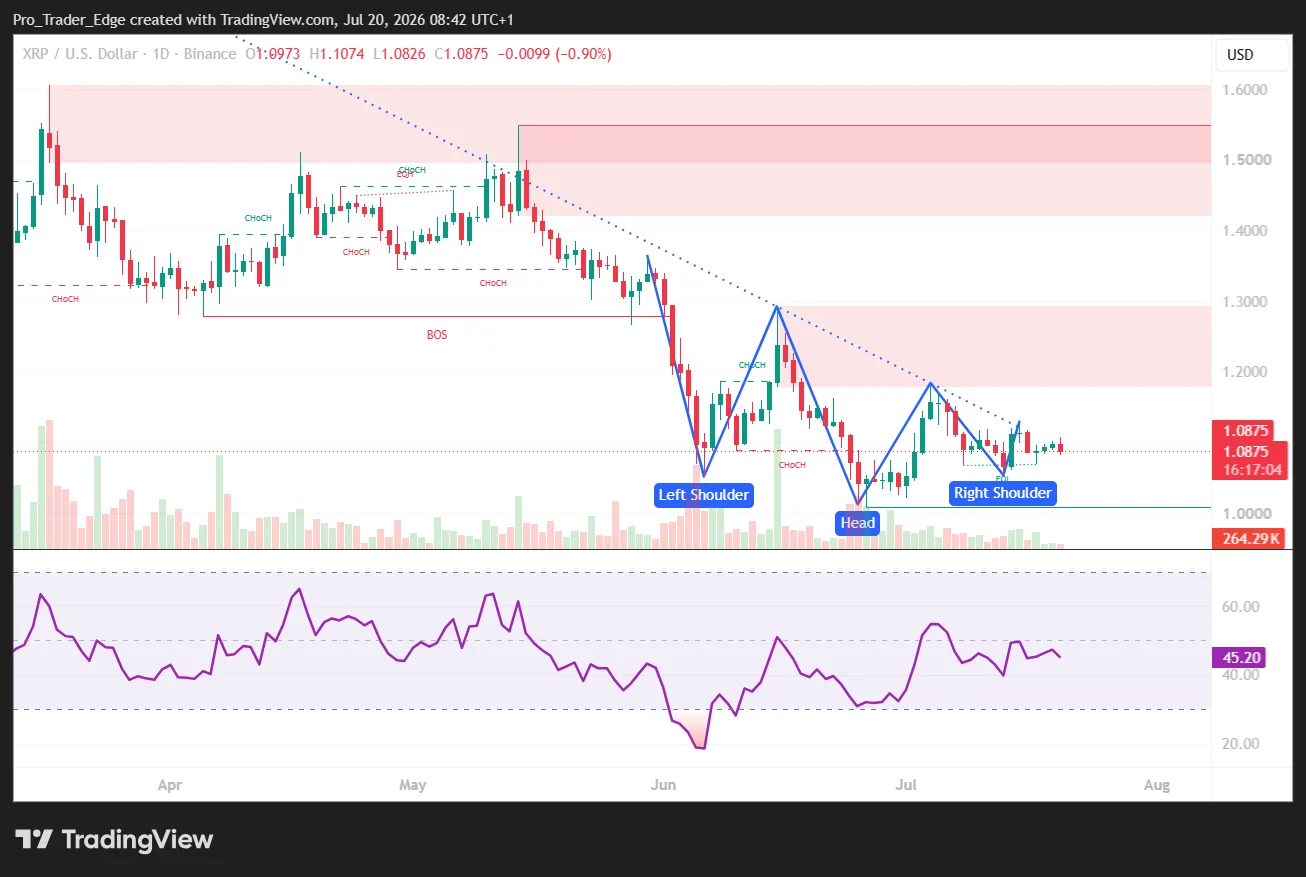
The same chart structure also displays XRP consolidating within a descending wedge formation. These two patterns overlap, establishing technical convergence. Should XRP successfully breach $1.12, subsequent resistance barriers appear at $1.15 followed by $1.18–$1.20. Projected measured moves from a confirmed breakout suggest targets reaching $1.25–$1.35.
Examining the 4-hour timeframe, XRP encountered rejection near $1.12–$1.13 before retreating toward $1.06. Maintaining support above $1.06 preserves the developing recovery framework.
Key Moving Averages Indicate Persistent Selling Pressure
XRP is trading beneath every significant moving average level. The 20-day simple moving average stands at $1.2885, the 50-day reaches $1.8896, the 100-day sits at $1.9167, and the 200-day rests at $1.2127. Each moving average functions as overhead resistance from current pricing.
The 14-period Relative Strength Index registers 34.06, positioned slightly above the oversold boundary at 30. The RSI signal line reads 34.82. These readings confirm sellers have maintained control recently, though declining momentum appears to be decelerating.
The XRP/BTC trading pair has also moved toward a significant SuperTrend retest zone. The monthly SuperTrend indicator shifted to bullish territory during 2024 after extended bearish positioning. Successful defense of this support could suggest XRP is beginning to rebuild relative strength versus Bitcoin.
At the time of publication, XRP was trading at $1.09, with the $1.10–$1.12 neckline zone remaining the decisive level for determining near-term price direction.
Get 3 Free Stock Ebooks
Discover top-performing stocks in AI, Crypto, and Technology with expert analysis.
- Top 10 AI Stocks - Leading AI companies
- Top 10 Crypto Stocks - Blockchain leaders
- Top 10 Tech Stocks - Tech giants


