



Key Highlights
- Spot Bitcoin ETFs in the United States attracted $986.9 million during the previous week, contributing to a $3.8 billion three-week accumulation
- IBIT from BlackRock dominated Friday’s activity with $117.4 million in inflows, representing roughly 67% of daily totals
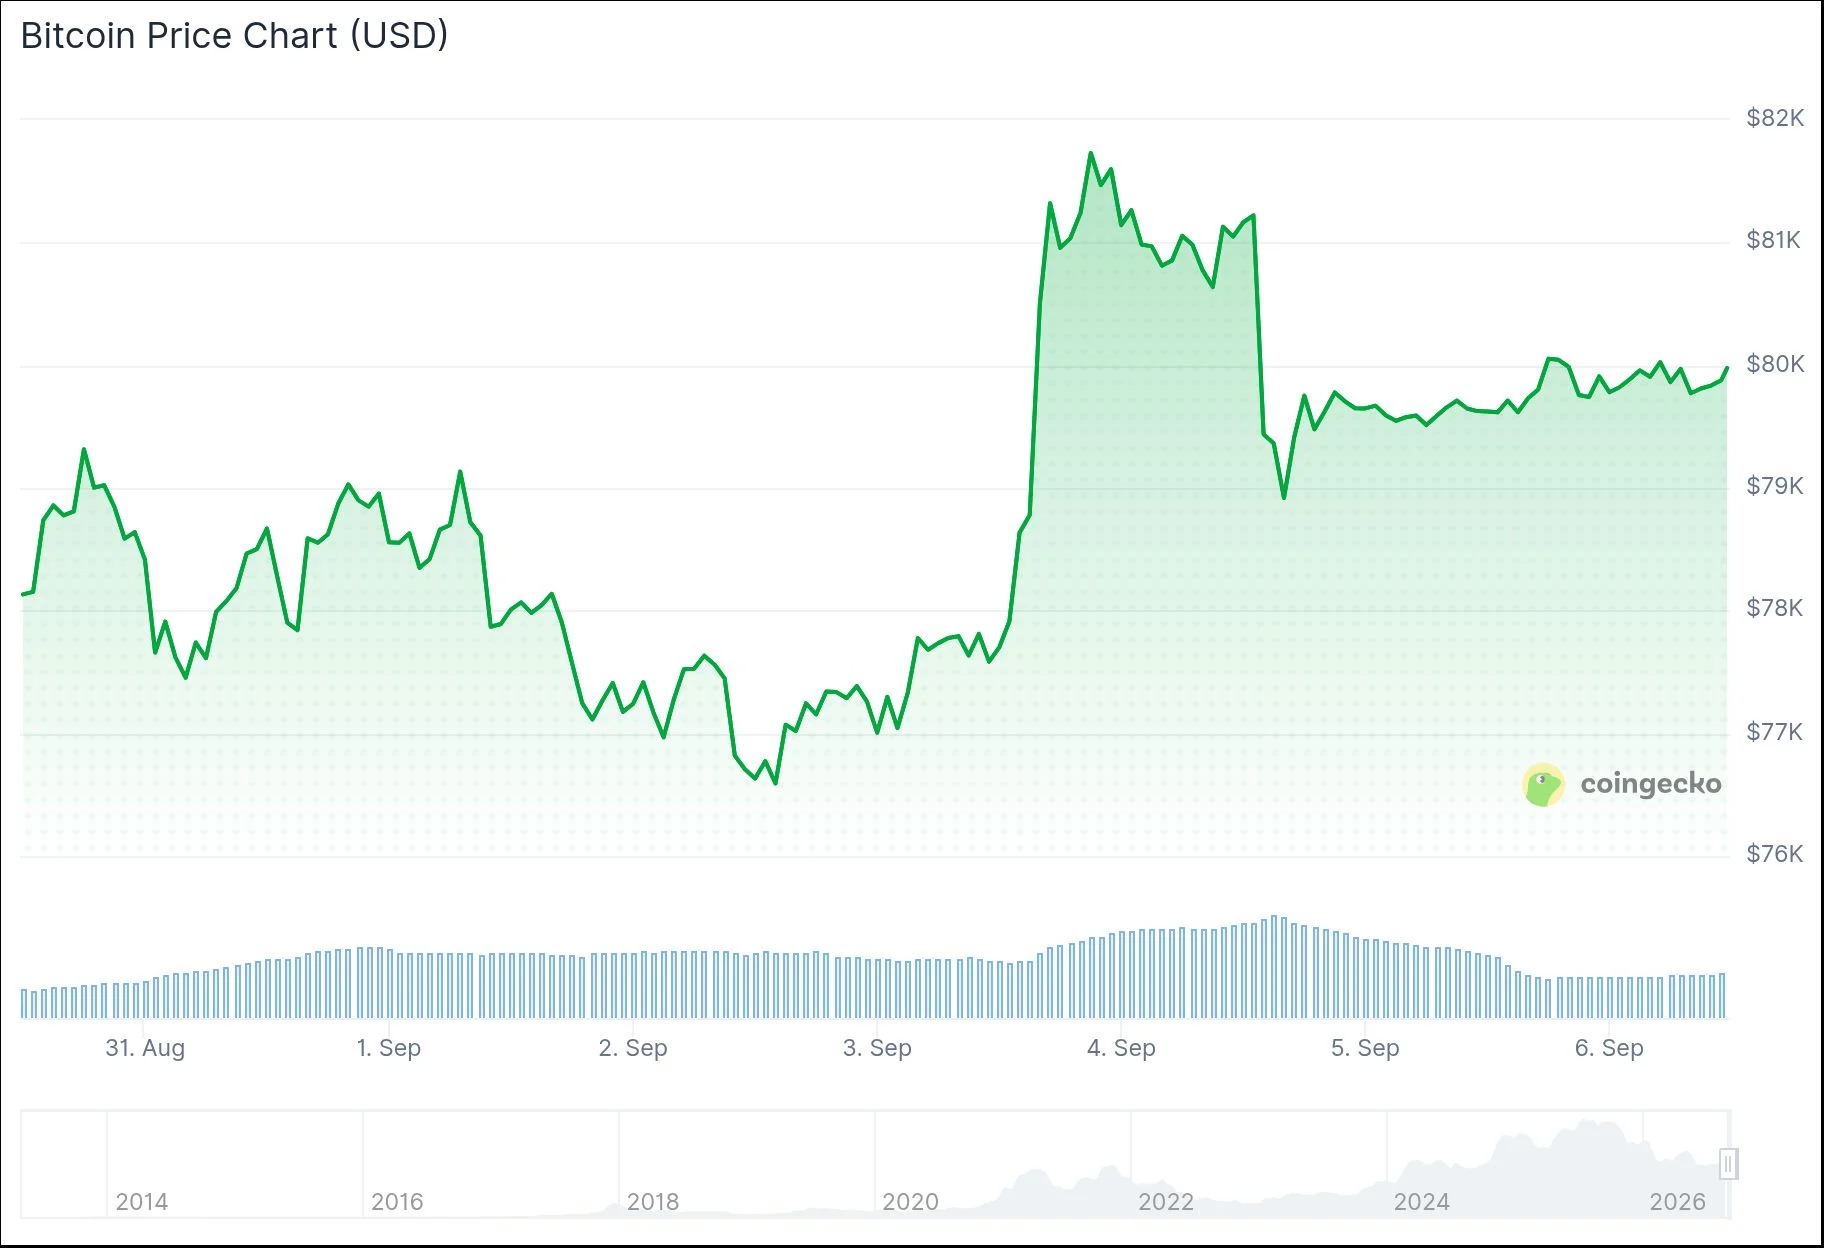
- At press time, Bitcoin was valued at $79,716, reflecting approximately 2.6% growth across a seven-day period
- Technical analysis shows Bitcoin’s 50-day EMA nearing convergence with its 200-day EMA, indicating a golden cross could materialize near September 11
- Market analysts from Coin Bureau identified the emerging golden cross as a traditionally positive signal, while cautioning about its lagging nature
United States-based spot Bitcoin exchange-traded funds have concluded their most impressive three-week accumulation period of 2026, securing $3.8 billion in aggregate net capital flows. The final week of this sequence, concluding Friday, September 5, alone contributed $986.9 million.
Aggregate net holdings across the complete suite of US spot Bitcoin ETFs reached $101.3 billion by Friday’s close, following a brief peak at $103.3 billion recorded one day earlier. Total cumulative net capital inflows climbed to $55.6 billion.
BlackRock’s iShares Bitcoin Trust (IBIT) emerged as Friday’s top performer, securing $117.4 million in new capital. Fidelity’s Wise Origin Bitcoin Fund (FBTC) represented the sole additional fund registering positive flows, contributing $57.2 million.
Friday’s combined inflow total reached $174.6 million, marking a significant decline from Thursday’s substantial $731 million figure.
Bitcoin’s price momentarily slipped beneath the $79,000 threshold on Friday before stabilizing at $79,716 by publication time. This represents an approximate 2.6% increase measured over the preceding week.

Comparing ETF Performance Across Assets
Weekly Bitcoin ETF capital inflows increased by approximately 7% on a week-over-week basis. Conversely, US spot Ether ETF inflows experienced a 74% contraction to $218.4 million, while XRP ETF inflows plummeted 83% to register just $19 million.
Despite these weekly fluctuations, both Ether and XRP ETFs maintain positive year-to-date performance. Ether ETFs have accumulated approximately $863 million in net inflows since January, while XRP ETFs have gathered roughly $515 million.
Bitcoin ETFs continue to show approximately $1 billion in negative net flows for the year-to-date period, notwithstanding the recent positive momentum shift.
Technical Analysis: Golden Cross Formation
Simultaneously, Bitcoin’s price chart is displaying development of a significant technical formation.
Data from September 1 showed Bitcoin’s 50-day exponential moving average positioned at $70,030, while the 200-day measure stood at $72,323. This creates approximately a 3.2% separation between the indicators.
A bullish crossover event — commonly referred to as a golden cross — is anticipated to materialize around September 11, assuming price levels remain relatively stable.
Cryptocurrency research platform Coin Bureau indicated via social media that Bitcoin is “about to flash a golden cross for the first time since November 2025.” Their analysis emphasized that the previous three completed golden cross formations preceded price surges of 50%, 45%, and 60% respectively. Nevertheless, they cautioned that this indicator functions as a lagging signal and has “sometimes reversed within weeks.”
Historical analysis of 12 golden cross occurrences dating back to 2012 reveals Bitcoin averaged 24.9% gains over three-month periods, although individual outcomes demonstrated considerable variation.
Analytics from CryptoQuant suggested that the late-August price surge originated primarily from short position liquidations in derivative markets rather than organic spot market purchasing activity.
On September 3, Bitcoin was exchanging hands near $77,000, positioning it above both exponential moving average benchmarks.
Get 3 Free Stock Ebooks
Discover top-performing stocks in AI, Crypto, and Technology with expert analysis.
- Top 10 AI Stocks - Leading AI companies
- Top 10 Crypto Stocks - Blockchain leaders
- Top 10 Tech Stocks - Tech giants


