


Crypto buyers often compare exchanges on fees, security and the coins they list. Liquidity gets less attention, but it often shapes the real cost of a trade.
Liquidity is how easily you can buy or sell a coin without moving its price. In a liquid market, your trade fills close to the price on the screen. In a thin market, the price you get can be far from the price you saw.
Research from S&P Global points to four main ways to measure crypto liquidity. These are trading volume, the bid-ask spread, market depth and slippage.
This article walks through each measure using worked figures drawn from exchange guides and market research. The numbers are examples that show how each measure works. Real market figures change by the second.
Crypto Liquidity Statistics at a Glance
The table below pulls together the main figures used in this article. Each comes from a worked example in guides and research from S&P Global, Kraken, Coinbase, ESMA and BitGo.
| Measure | Example | Figure |
|---|---|---|
| Bitcoin bid-ask spread | Bid $79,990, ask $80,010 | $20 (0.025%) |
| Small token bid-ask spread | Bid $0.95, ask $1.05 | $0.10 (10%) |
| Instant buy-then-sell loss | Small token example | About 9.52% |
| Slippage on a 5,000 token order | Quoted at $2.00 | 3% ($300 extra) |
| Price impact on a $500,000 sale | Deep vs thin exchange | $500 vs $10,000 |
| Volume vs depth | Token A | $100 million volume, $20,000 depth |
| Order size vs depth | $500,000 order, $1 million depth | 50% of depth used |
What Crypto Exchange Liquidity Means
Liquidity describes how easily a digital asset can be bought or sold without changing its price by much. A liquid market has enough buyers and sellers to handle trades quickly.
Kraken describes liquidity as the ability to trade efficiently without moving the market price. It says liquidity affects trading costs, market stability and the overall trading experience.
Liquidity is not fixed. Bitcoin may trade smoothly on a normal day, then see wider spreads and thinner order books during a sudden market shock.
The reverse can also happen. A small coin may draw a burst of trading after a major announcement, then go quiet again.
The key point is simple. A quoted price matters less if you cannot buy or sell a real amount near that price.
How a Crypto Order Book Works
An order book is a live list of buy and sell orders on an exchange. It shows the prices traders will accept and how much is on offer at each price.
A bid is the price a buyer will pay. An ask is the price a seller will accept. The gap between the best bid and the best ask is called the spread.
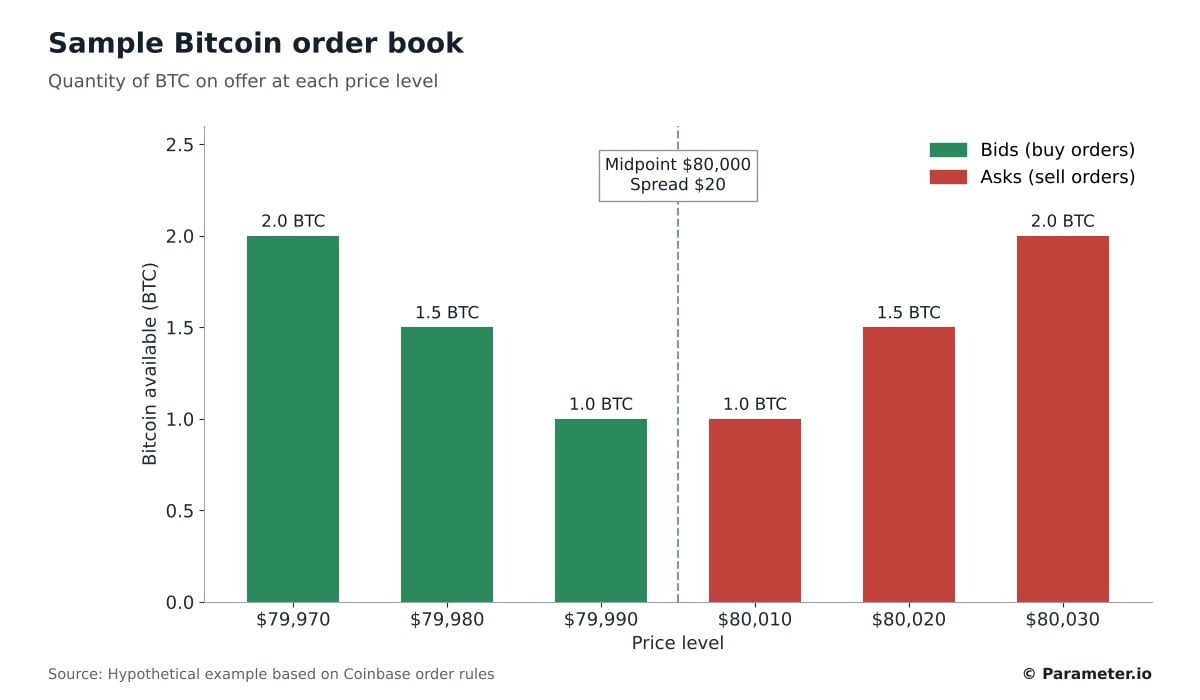
The table below shows a simple Bitcoin order book with a midpoint price of $80,000.
| Side | Price | Available BTC |
|---|---|---|
| Ask (sell) | $80,030 | 2.0 |
| Ask (sell) | $80,020 | 1.5 |
| Ask (sell) | $80,010 | 1.0 |
| Midpoint | $80,000 | |
| Bid (buy) | $79,990 | 1.0 |
| Bid (buy) | $79,980 | 1.5 |
| Bid (buy) | $79,970 | 2.0 |
The best bid is $79,990 and the best ask is $80,010. That makes the spread $20.
A small buy order would fill at $80,010. A bigger order would use up that 1 BTC and keep buying at $80,020 and then $80,030.
Buying all 4.5 BTC on the ask side would cost $360,100. That is an average of about $80,022 per coin, or $22 above the midpoint.
Traders call this walking up the order book. Coinbase’s trading rules note that market orders can fill across several price levels, depending on order size and the orders available.
The Bid-Ask Spread in Numbers
The spread is one of the easiest liquidity measures to check. It shows the instant cost of crossing from one side of the market to the other.
The formula is simple. The spread equals the lowest ask minus the highest bid. To get a percentage, divide the spread by the midpoint price and multiply by 100.
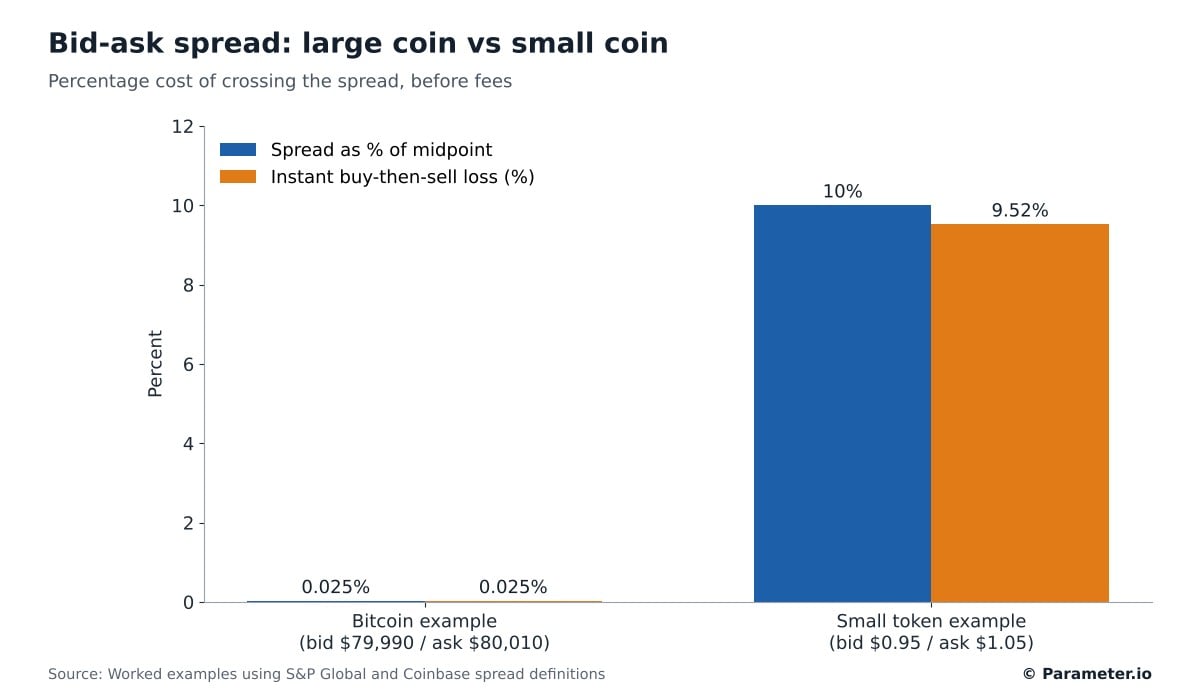
In the Bitcoin example, the spread is $20 on a midpoint of $80,000. That works out to 0.025%.
Now take a smaller coin with a best bid of $0.95 and a best ask of $1.05. The spread is $0.10, which is 10% of the $1 midpoint.
If you bought that coin at $1.05 and sold right away at $0.95, you would lose about 9.52% of what you paid. That is before any exchange fees.
| Figure | Bitcoin example | Small token example |
|---|---|---|
| Highest bid | $79,990 | $0.95 |
| Lowest ask | $80,010 | $1.05 |
| Midpoint | $80,000 | $1.00 |
| Spread | $20 | $0.10 |
| Spread as % of midpoint | 0.025% | 10% |
| Loss on instant buy and sell | About 0.025% | About 9.52% |
In percentage terms, the small coin’s spread is 400 times wider. This is why a coin with a low price tag can still carry high hidden trading costs.
A tight spread is a good sign, but it is not the full picture. An exchange can show sharp prices with only small amounts behind them. That is why spread and depth should be read together.
Market Depth: How Much Can a Market Absorb?
Market depth measures how many buy and sell orders sit at different price levels. A deep market can take larger trades without big price moves. A shallow market cannot.
Analysts often measure depth within 1% or 2% of the midpoint. For example, 1% ask depth counts all sell orders priced up to 1% above the midpoint. 1% bid depth counts buy orders up to 1% below it.
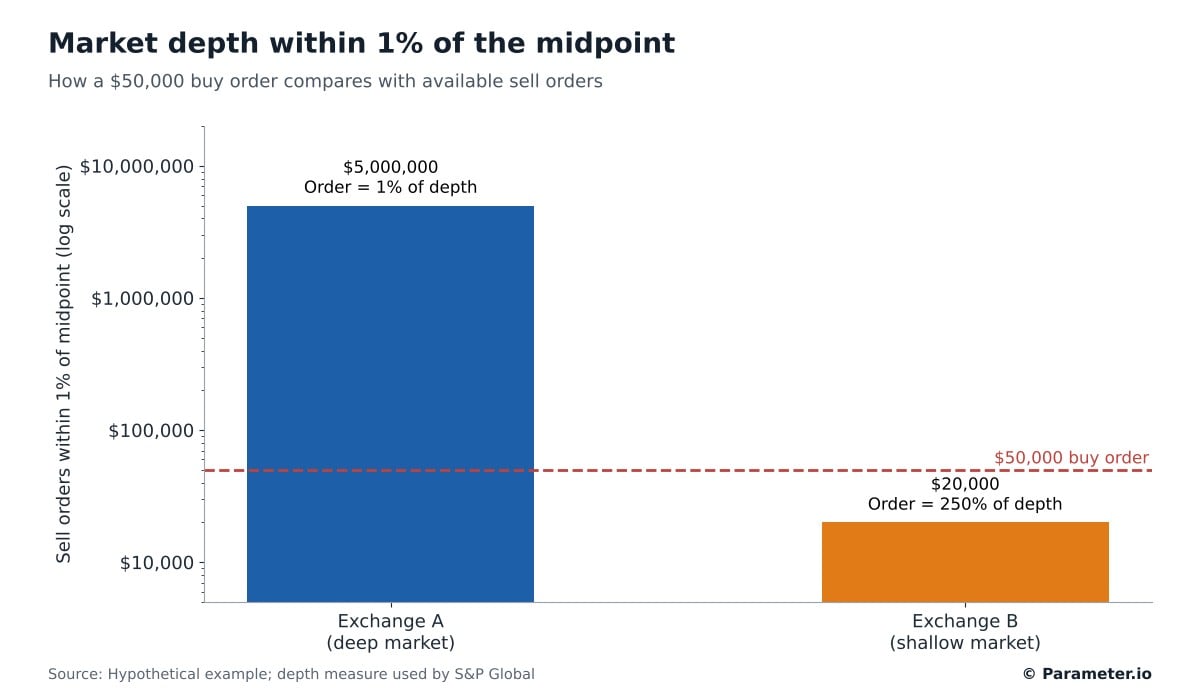
Consider two exchanges. Exchange A has $5 million of Bitcoin sell orders within 1% of the midpoint. Exchange B has only $20,000.
| Exchange | 1% ask depth | $50,000 order as share of depth | Likely result |
|---|---|---|---|
| Exchange A | $5,000,000 | 1% | Fills with little price impact |
| Exchange B | $20,000 | 250% | Uses up nearby orders and fills at higher prices |
A $50,000 buy order uses just 1% of the depth on Exchange A. On Exchange B, the same order is two and a half times the depth within 1%.
S&P Global uses depth alongside volume, spreads and slippage to judge liquidity quality. Keep in mind that order books change all the time. Orders on screen can be cancelled before they fill, so displayed depth is not guaranteed.
Slippage: The Hidden Cost of a Trade
Slippage happens when a trade fills at a different price than expected. It can come from thin liquidity, fast price moves or changes in the order book before the order fills.
Slippage can work for or against you. Most traders focus on the bad kind because it adds to the cost.
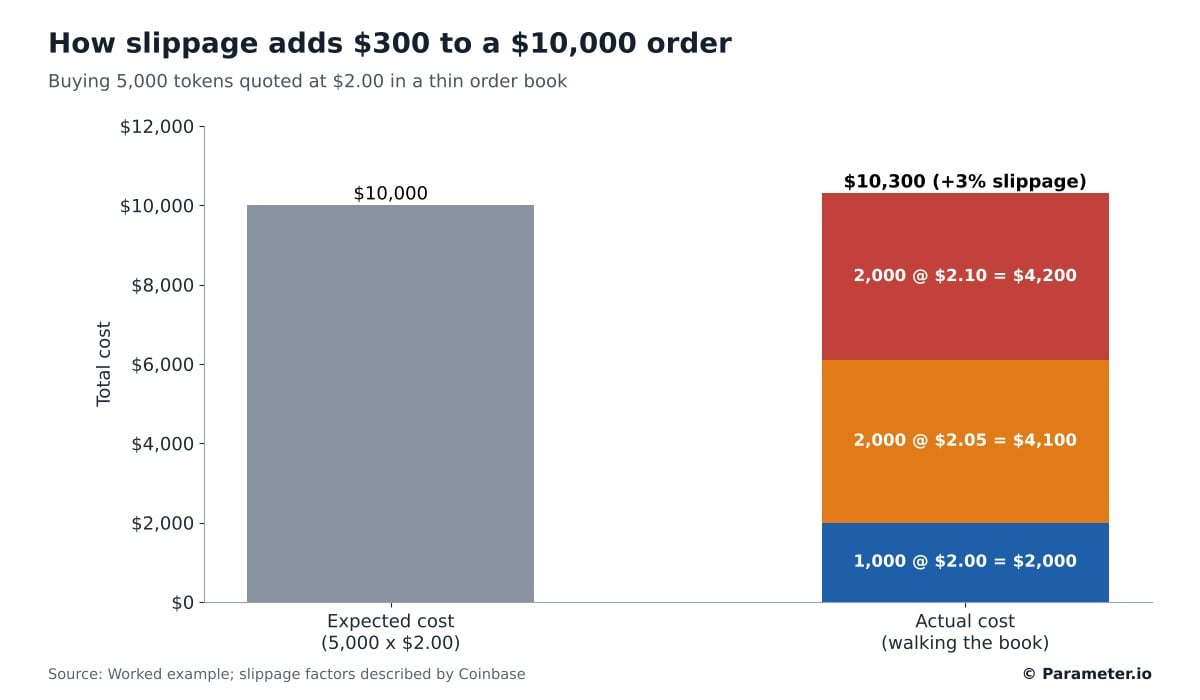
Here is an example. A coin trades at $2 and an investor wants 5,000 tokens. At $2, the order should cost $10,000, but the exchange only has 1,000 tokens for sale at that price.
| Tokens bought | Price | Cost |
|---|---|---|
| 1,000 | $2.00 | $2,000 |
| 2,000 | $2.05 | $4,100 |
| 2,000 | $2.10 | $4,200 |
| 5,000 | $2.06 average | $10,300 |
The investor pays $10,300 instead of $10,000. The average price is $2.06, which is 3% above the quoted price.
That is $300 in extra cost before any exchange fees. On smaller coins or larger orders, the gap can be much wider.
Coinbase says slippage is shaped by volatility, trading activity and available liquidity. The exchange also offers tools meant to stop orders from filling at very poor prices.
Trading Volume Is Not the Same as Liquidity
Trading volume measures how much of a coin changed hands over a set period. Liquidity measures how easily a new trade can be made without moving the price. The two are linked, but they are not the same.
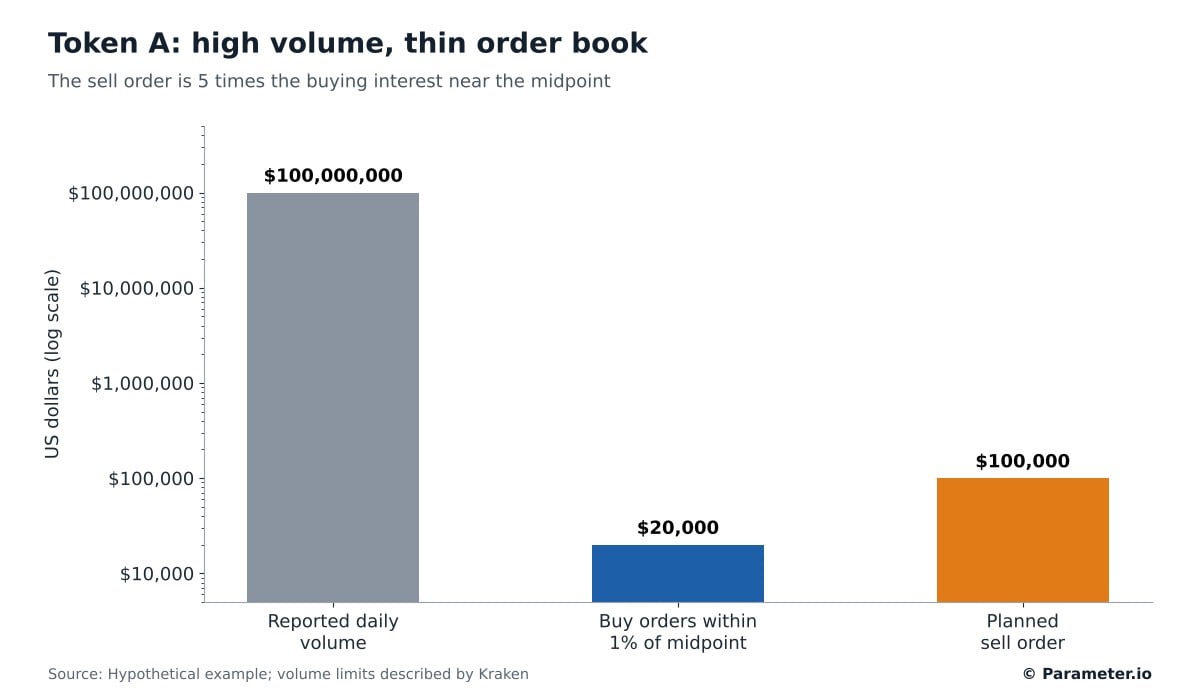
Take Token A, which reports $100 million in daily volume. Its order book holds only $20,000 of buy orders within 1% of the midpoint.
An investor selling $100,000 of Token A would need five times the buying interest on hand in that range. Heavy slippage is likely, even with the large volume figure.
Token B may report less volume but have deeper order books and tighter spreads. For the same trade, Token B could give a better price.
Fake Volume and Order Book Tricks
Volume figures can also be inflated. Wash trading creates the look of activity without any real change in who owns the coins.
Kraken names wash trading and fabricated trades as reasons not to treat volume as a full measure of market quality.
Spoofing is another problem. It means placing large orders with no plan to fill them, then cancelling them. This can make supply or demand look stronger than it really is.
Why Liquidity Differs Between Exchanges
The same coin can trade very differently from one platform to the next. Each exchange runs its own order book, draws its own users and pays different incentives to liquidity providers.
The trading pair also matters. BTC/USDT may be far more liquid than Bitcoin paired with a less common currency. An exchange may have deep ETH/USD markets but little liquidity for a small token paired with ETH.
A 2024 study by the European Securities and Markets Authority (ESMA) found that crypto liquidity was concentrated among a small number of large exchanges. It also found that liquidity varied considerably between platforms, and that heavily traded assets tended to have stronger liquidity.
Bitcoin and Ethereum generally have the deepest markets. They list on many exchanges and draw retail traders, trading firms and institutions. Even so, a Bitcoin pair on a major exchange can give much better fills than the same pair on a small one.
Market cap alone does not measure liquidity. A coin can have a large value on paper while much of its supply sits with founders, investors or project treasuries.
The Role of Market Makers
Market makers post buy and sell quotes on both sides of the order book. They often earn money from the spread or from exchange incentives.
Say a market maker quotes Bitcoin at $79,995 to buy and $80,005 to sell. If it buys at the bid and sells at the ask, it earns the $10 gap before fees and other costs. It also takes the risk that prices move before it can close out.
Market makers can tighten spreads and improve fills. But they may widen quotes or pull orders when markets turn volatile. BitGo’s October 2026 analysis stresses that the liquidity you can actually trade against can differ from what the order book shows.
What This Means for Large Trades
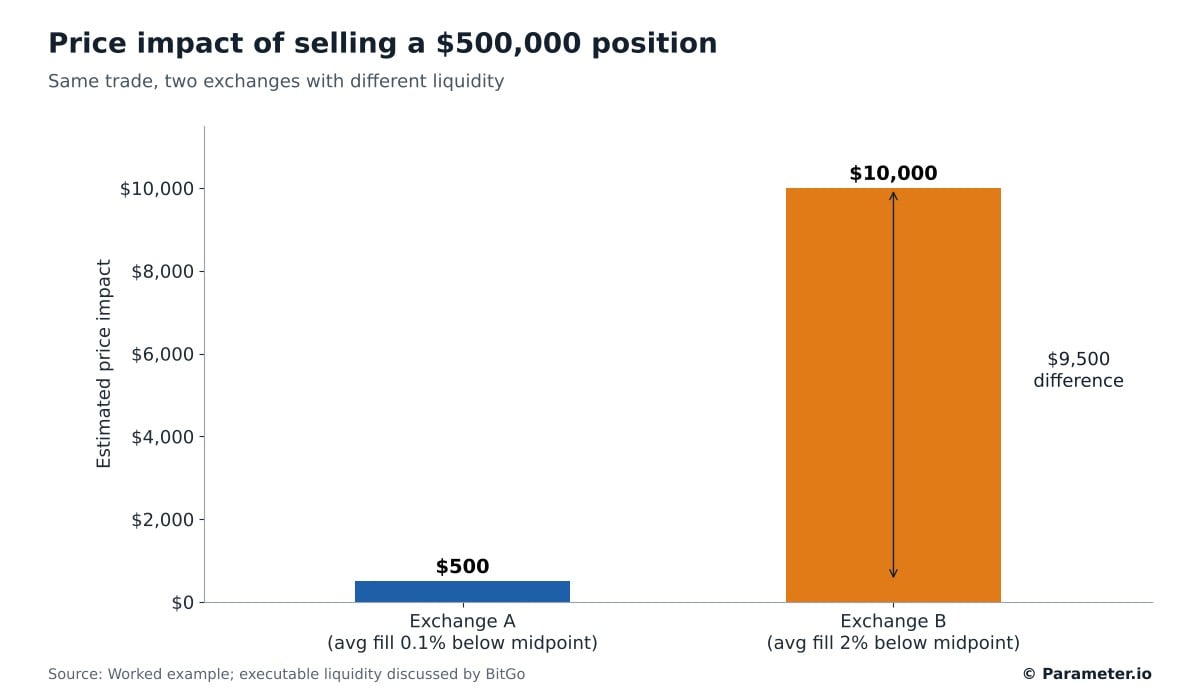
The gap between exchanges grows with trade size. Suppose an investor sells $500,000 of a coin.
On Exchange A, the sale fills at an average of 0.1% below the midpoint. That is about $500 in price impact. On Exchange B, weaker liquidity pushes the average fill 2% below the midpoint, or about $10,000.
The difference is $9,500 before trading fees. Large investors often split orders to reduce this impact.
Coinbase describes time-weighted average price (TWAP) orders, which break a large trade into smaller pieces over time. This can lower impact, but prices may move while the order runs.
| Exchange | Average fill vs midpoint | Estimated price impact |
|---|---|---|
| Exchange A | 0.1% below | About $500 |
| Exchange B | 2% below | About $10,000 |
| Difference | $9,500 |
How Much Liquidity Is Enough?
There is no single liquidity level that suits every trade. What you need depends on how big your order is and how much slippage you can accept.
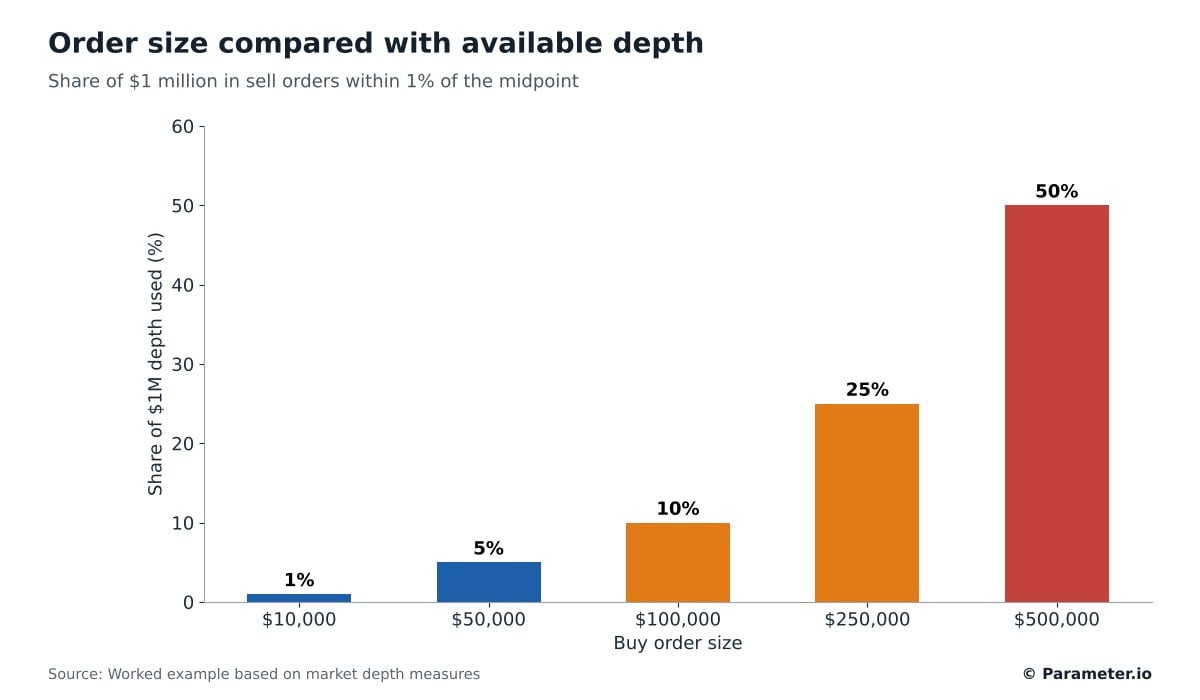
A useful check is to compare your order with the depth on offer. Suppose an exchange shows $1 million of sell orders within 1% above the midpoint.
| Buy order size | Share of $1 million depth used |
|---|---|
| $10,000 | 1% |
| $50,000 | 5% |
| $100,000 | 10% |
| $250,000 | 25% |
| $500,000 | 50% |
A $10,000 buy uses just 1% of that depth. A $500,000 buy uses half of it and is much more likely to move the price.
The actual result also depends on how orders are spread across prices and whether new orders appear during the trade.
This is why the percentage matters more than the dollar amount. A $50,000 order may be small in a deep Bitcoin market but large in a thin altcoin market.
Liquidity on Decentralised Exchanges
Decentralised exchanges, or DEXs, run on blockchain protocols. Some use order books. Many use automated market makers (AMMs) and liquidity pools instead.
A liquidity pool holds two tokens locked in a smart contract, such as ETH and USDC. Traders swap against the pool, and each trade changes the balance of tokens inside it.
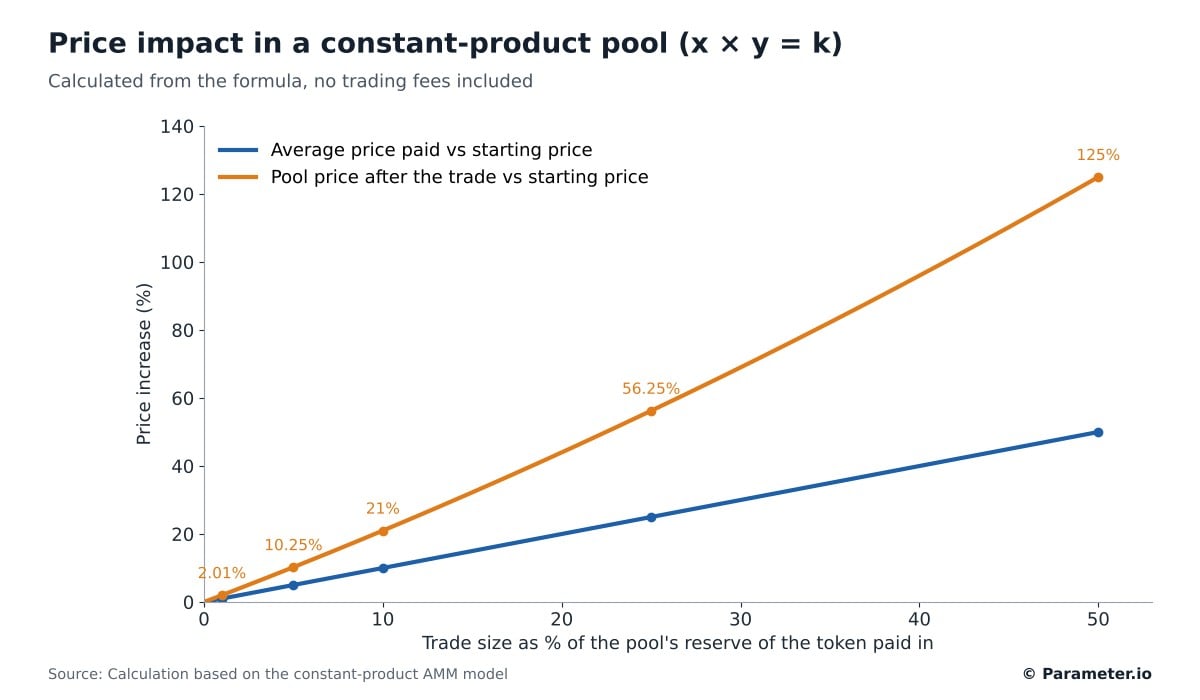
In a basic constant-product pool, the two reserves follow the rule x × y = k. As traders buy one token, its supply in the pool falls and its price rises.
The table below shows what the formula produces for trades of different sizes. These are calculated results with no trading fees, not live market data.
| Trade size (% of pool reserve paid in) | Average price paid vs start | Pool price after trade vs start |
|---|---|---|
| 1% | +1% | +2.01% |
| 5% | +5% | +10.25% |
| 10% | +10% | +21% |
| 25% | +25% | +56.25% |
| 50% | +50% | +125% |
A trade worth 1% of the pool’s reserve raises the average price by about 1%. A trade worth half the reserve raises it by 50% and more than doubles the pool price.
Many newer DEXs use concentrated liquidity and other designs, which change these numbers. Traders should look at liquidity near the current price, not just a pool’s total value.
Price Impact vs Slippage on a DEX
Price impact is how much your trade moves the pool’s price. Slippage is the gap between the quoted price and the price you actually get.
Many DEXs let users set a slippage tolerance, such as 0.5%. If the final price is worse than that limit, the trade fails.
Slippage tolerance does not remove the price impact already in the quote. Setting a very high tolerance can expose traders to poor fills and some forms of manipulation.
Market Orders vs Limit Orders
The type of order you use affects how liquidity shapes your price. Coinbase notes that market orders put speed first, while limit orders let traders set price conditions.
| Feature | Market order | Limit order |
|---|---|---|
| Execution speed | Usually immediate | Depends on market conditions |
| Price control | Limited | Greater |
| Slippage exposure | Can be high | Capped by the limit price |
| Execution certainty | Higher when liquidity exists | Not guaranteed |
| Suited to | Small or time-sensitive trades | Price-sensitive trades |
A limit order sets the worst price you will accept, but it may never fill. A market order fills right away, but the final price depends on what is in the book.
When Liquidity Dries Up
Liquidity often falls when it is needed most. In a sudden sell-off, some market makers cut their exposure and other traders cancel buy orders.
Order books thin out just as more people want to sell. Spreads widen and slippage grows, so even small trades can move prices.
The Canadian Securities Administrators warn that crypto investors can face limited liquidity, trading halts and limits on withdrawals.
A thin order book is a different problem from an exchange funding problem. The second happens when an exchange cannot meet withdrawal requests. High trading volume does not prove that an exchange can meet its obligations.
Crypto Liquidity Checklist
The checklist below can help investors judge liquidity before placing a trade.
| Factor | What to check | Why it matters |
|---|---|---|
| Bid-ask spread | Gap between best bid and best ask | Shows the instant trading cost |
| Market depth | Orders near the midpoint | Shows likely price impact |
| Trading volume | Recent genuine activity | Gives context on participation |
| Slippage | Expected vs actual fill price | Reveals hidden costs |
| Trading pair | Liquidity in the exact market | Avoids misleading comparisons |
| Order book stability | Whether orders stay in place | Helps judge fill reliability |
| Exchange reputation | Operating and regulatory record | Flags platform risk |
| Market conditions | Volatility and major events | Liquidity can fall quickly |
| Trade size | Order value vs depth | Shows how hard the trade may be |
| Total costs | Fees, spread and slippage | Gives the real cost of trading |
For most investors, the most useful numbers are the spread, the depth near the midpoint and the expected fill price. These have the most direct effect on what you pay or receive.
The Bottom Line
A coin can show a strong price, high volume and a large market cap. None of that helps much if you cannot trade near the quoted price.
Spread, depth and slippage give a clearer view of what a trade will really cost. They vary by exchange, by trading pair and by market conditions.
The main question is not what a coin is worth on screen. It is what price you can actually get for the amount you want to trade.
This article is for information only and is not financial advice. Crypto assets are volatile and can lose some or all of their value.
Sources
- S&P Global: A Dive Into Liquidity Demographics for Crypto Asset Trading
- Kraken: Why Liquidity Is an Important Metric in Crypto Markets
- Coinbase: Understanding Advanced Trade Order Types
- ESMA: Crypto Assets: Market Structures and EU Relevance
- BitGo: Liquidity in Crypto Markets: What It Means and How It’s Measured
- Coinbase: Understanding Slippage and Spread
- Canadian Securities Administrators: Recognizing Crypto Risks
- Kraken: The Markets Series Part 4: Liquidity and Market Impact


