


Perpetual futures are some of the most widely used tools in crypto trading. They let traders bet on the price of Bitcoin, Ethereum and other coins without buying the coins themselves.
These contracts have no fixed end date. A trader can keep a position open for as long as they meet the exchange’s margin rules.
That flexibility has a price. Funding payments, trading fees and leverage can all change the result of a trade, sometimes by a large amount.
This article uses worked examples from exchange guides at Binance, Coinbase and Deribit, along with warnings from US and European regulators. The numbers show how perpetual futures work and what they can cost.
Key Numbers at a Glance
The table below pulls together the main figures covered in this article. Most are worked examples, so real costs will depend on the exchange, the contract and market conditions.
| Measure | Figure |
|---|---|
| Binance funding times per day (many contracts) | 3, at 00:00, 08:00 and 16:00 UTC |
| Coinbase International funding settlement | Every hour |
| Deribit funding quote | Per 8 hours, accrued continuously |
| Funding on $50,000 at 0.03% per 8 hours | $1,350 over 30 days |
| Price move that equals full margin at 10x | About 10% |
| Price move that equals full margin at 100x | About 1% |
| Example taker fee | 0.05% of position value |
| ESMA statement on perpetual futures | February 2026 |
What Are Crypto Perpetual Futures?
A perpetual futures contract is a derivative. Its value follows the price of a cryptocurrency, but the trader does not own the coin.
A trader who expects Bitcoin to rise can open a long position. A trader who expects it to fall can open a short position.
Regular futures contracts end on a set date. Perpetual contracts do not, which is where the name comes from. A position stays open while the trader meets margin rules and the exchange keeps offering the contract.
Buying Bitcoin on a spot exchange is different. A spot buyer holds the actual coin and can often move it to a personal wallet. A perpetual futures trader only holds a contract tied to Bitcoin’s price.
How Long and Short Positions Gain and Lose
Gains and losses depend on the position’s notional value. This is the full size of the position, not the cash put down to open it.
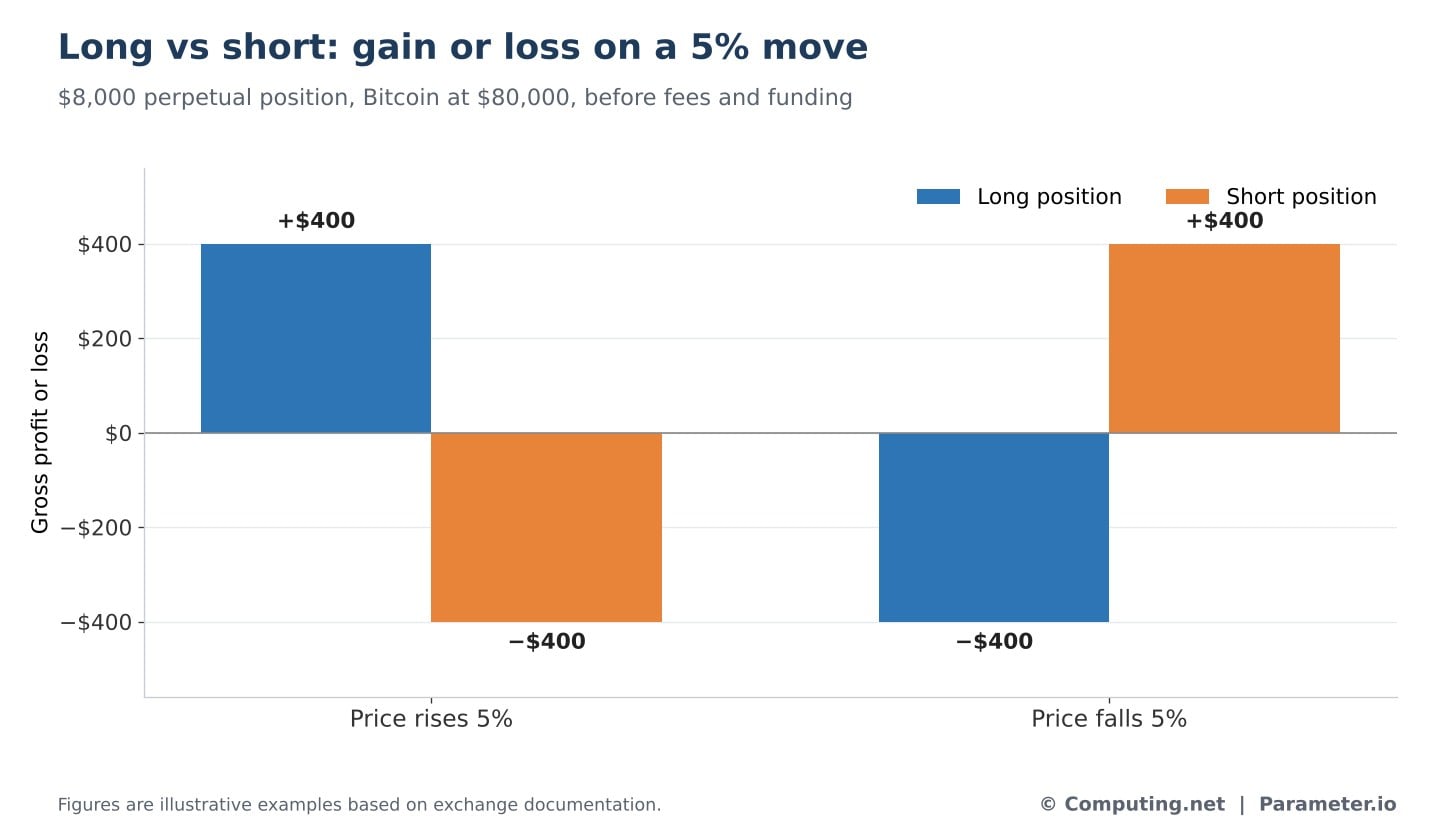
Say Bitcoin trades at $80,000 and a trader opens an $8,000 position. If the price rises 5%, a long position gains about $400 and a short position loses about $400.
If the price falls 5%, the result flips. The long loses about $400 and the short gains about $400. These figures leave out fees and funding.
Traders close a position by placing the opposite trade. The exchange can also close a position by force if the margin falls too low. This is called liquidation.
Short positions carry a special risk. Crypto prices can rise quickly and without warning, which can lead to fast losses for short sellers.
Perpetual Futures vs Spot Trading and Traditional Futures
Perpetual futures look a lot like regular futures, but a few differences change how traders use them. The table compares the three main ways to trade crypto prices.
| Feature | Spot trading | Traditional futures | Perpetual futures |
|---|---|---|---|
| Own the coin | Usually yes | Usually no | Usually no |
| Fixed end date | No | Yes | Generally no |
| Leverage available | Sometimes | Usually | Usually |
| Short selling | Needs extra steps | Yes | Yes |
| Funding payments | No | Not normally | Yes |
| Liquidation risk | Usually none without borrowing | Yes | Yes |
| Margin rules | Not for fully paid buys | Yes | Yes |
| Main use | Ownership or investing | Hedging and speculation | Ongoing price exposure |
Regular futures prices can drift away from spot prices. This happens because of financing costs and the time left before the contract ends. As the end date gets closer, the two prices usually come together.
Perpetual contracts have no end date to pull prices back in line. Exchanges use funding payments instead. Deribit’s documentation describes funding as central to keeping perpetual prices close to the spot market.
How Crypto Funding Rates Work
A funding rate sets regular payments between traders holding long positions and those holding short positions. Its job is to keep the contract price close to the price of the coin it tracks.
When the rate is positive, longs pay shorts. This usually happens when the perpetual price is above the spot price index.
When the rate is negative, shorts pay longs. This usually happens when the perpetual price is below the spot index.
Funding normally moves from one group of traders to the other. It is not a commission kept by the exchange. Binance, Coinbase and Deribit all describe it this way.
The Basic Funding Formula
Most exchanges base the payment on the position’s notional value. A simple version used for many USDT- and USDC-margined contracts is: Funding payment = Position notional value × Funding rate.
On a $20,000 long position with a rate of 0.01% for an eight-hour period, the long pays about $2. Over three periods in a day, that adds up to about $6.
If the rate turns negative to 0.02%, the same long position receives about $4 for the period. The short side pays that amount.
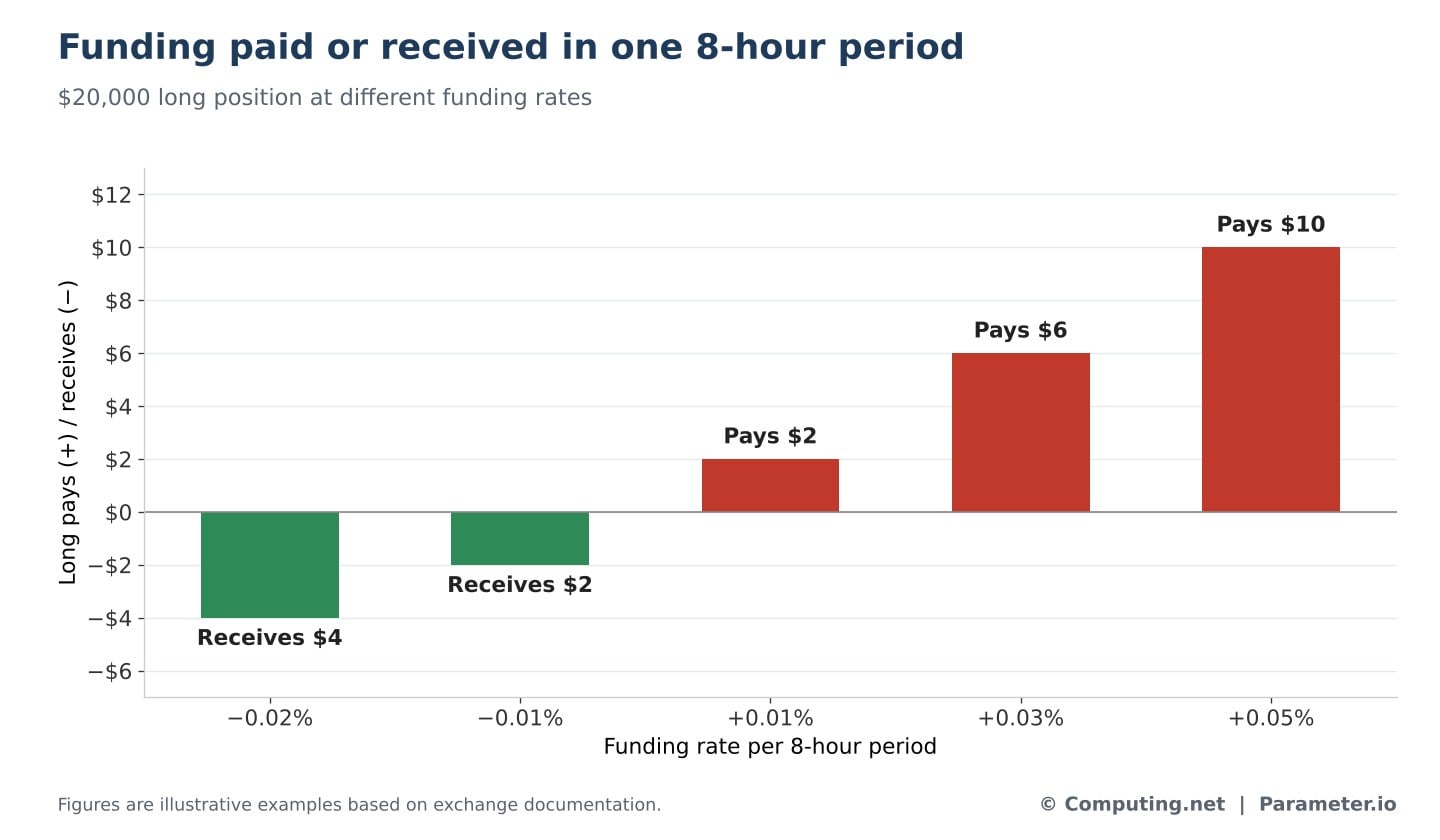
These examples are kept simple on purpose. Rates can change from one period to the next, and position values move with prices.
Some exchanges also add interest rate parts, smoothing steps or caps to their formulas. Traders should read the funding rules for their own contract.
How Often Funding Is Paid
Funding schedules differ between platforms. Some charge every eight hours, others every hour, and some calculate funding all the time.
| Exchange | Funding schedule | How it works |
|---|---|---|
| Binance (many perpetual contracts) | Every 8 hours | Paid at 00:00, 08:00 and 16:00 UTC; some contracts differ |
| Coinbase International Exchange | Every hour | Accrues continuously, settled hourly |
| Deribit | Quoted per 8 hours | Calculated and accrued continuously |
Binance notes that some contracts use other schedules. Intervals can also change during unusual market conditions.
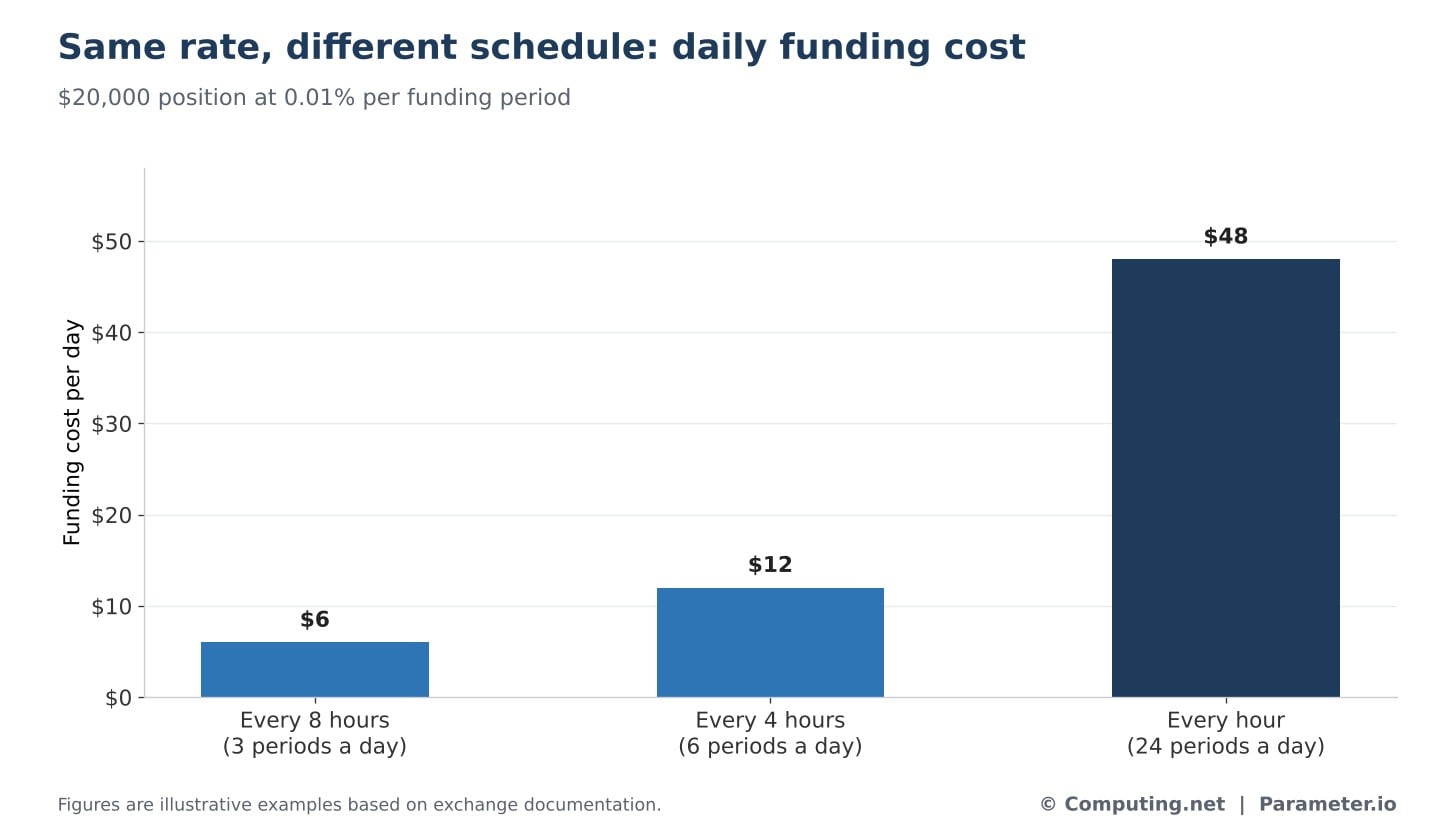
A funding rate means little without its time period. A rate of 0.01% charged every hour costs eight times as much as 0.01% charged every eight hours.
On a $20,000 position, 0.01% every eight hours costs about $6 a day. The same rate charged every hour costs about $48 a day.
Traders should also check whether funding builds up continuously or only applies to positions open at a set time. This matters for anyone holding a trade across several funding periods.
How Much Funding Costs Over Time
Small funding rates add up when a position stays open for weeks. A trade that looks cheap on day one can become costly by the end of the month.
Take a $50,000 long position with a funding rate of 0.03% every eight hours. Each period costs about $15. With three periods a day, the cost is about $45 per day.
| Holding period | Funding cost | Share of $50,000 position |
|---|---|---|
| 8 hours | $15 | 0.03% |
| 1 day | $45 | 0.09% |
| 7 days | $315 | 0.63% |
| 30 days | $1,350 | 2.7% |
After 30 days, the total reaches about $1,350. That equals 2.7% of the position’s value, before any trading fees.
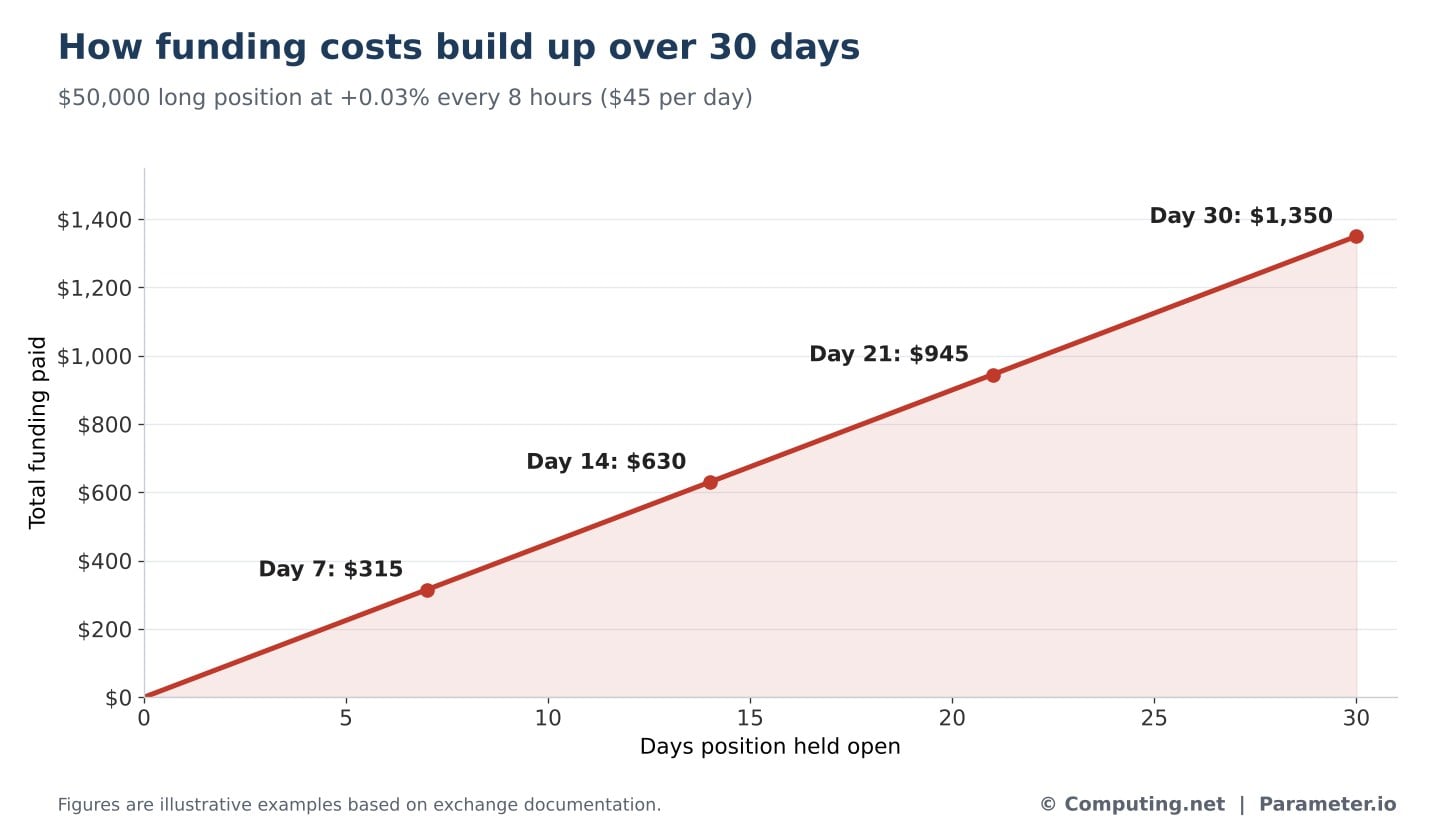
These figures assume the rate and position size stay the same, which rarely happens. Funding can also flip, so a trader may receive payments instead of paying them.
Even so, counting on future funding income is risky. A trader can be right about the price direction and still earn a weak return because of funding costs.
Leverage by the Numbers
Leverage lets a trader control a position larger than the cash they put in. It is shown as a multiple, such as 2x, 5x, 10x or 20x.
With 5x leverage, about $1,000 of margin can open a $5,000 position. With 10x leverage, the same $1,000 can open a $10,000 position.
Leverage makes gains and losses larger by the same factor. On a $10,000 position at 10x, a 5% price rise brings a gross gain of about $500, or 50% of the margin.
A 5% price fall brings a loss of about $500. That wipes out half of the starting margin.
| Price move | Unleveraged $1,000 | $10,000 position at 10x | Change vs $1,000 margin |
|---|---|---|---|
| +2% | +$20 | +$200 | +20% |
| +5% | +$50 | +$500 | +50% |
| −2% | −$20 | −$200 | −20% |
| −5% | −$50 | −$500 | −50% |
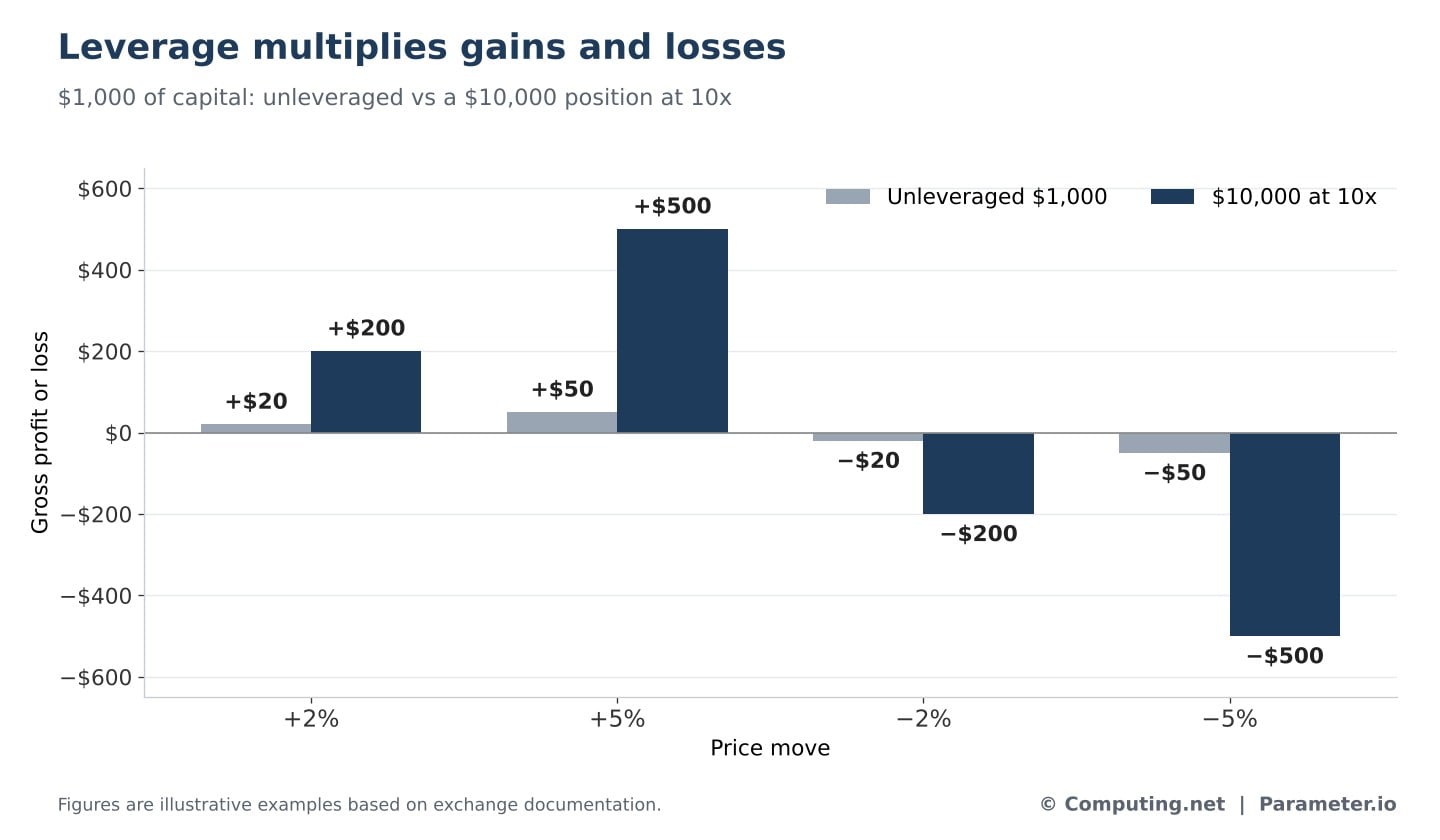
The US Commodity Futures Trading Commission (CFTC) warns that leverage can increase losses on crypto futures. It also says some investors can lose more than the money they first put in.
Liquidation and Margin Explained
Liquidation happens when a leveraged position no longer meets the exchange’s margin rules. The exchange may then cut or close the position automatically.
Two margin terms matter here. Initial margin is the cash needed to open a position. Maintenance margin is the smallest amount of equity needed to keep it open.
Higher leverage means a smaller price move can wipe out the margin. At 10x, a drop of about 10% equals the full initial margin. At 100x, a move of just 1% does the same.
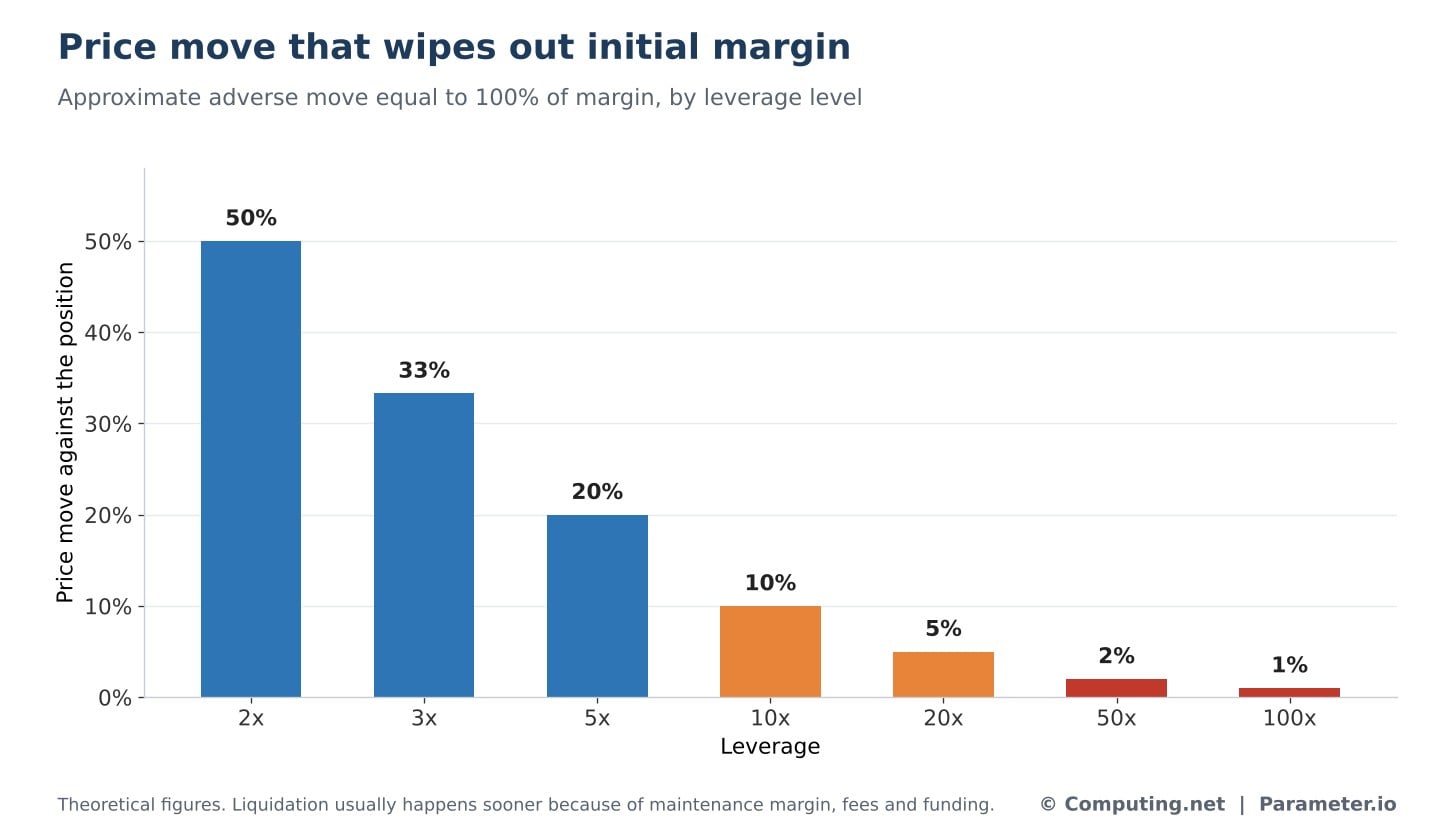
In practice, liquidation usually comes before the full margin is gone. Exchanges require maintenance margin, and fees and funding also shift the liquidation point.
That means the real liquidation price cannot be found just by dividing 100% by the leverage number. Rules differ by exchange, contract size, collateral type and leverage.
This is a key difference from simply holding coins. A spot holder can wait out a price drop. A leveraged trader may be closed out before prices recover.
Mark Price vs Last Price
Exchanges often show more than one price for a contract. The last price is the most recent trade, and it can jump to unusual levels when trading is thin.
The mark price is a reference price the exchange calculates, often using spot price indexes. Many exchanges use it for profit and loss, margin checks and liquidation.
Binance’s rules state that liquidation happens when the mark price reaches or crosses the liquidation level. A trader watching only the last price on a chart could be caught off guard.
What Trading Fees Add Up To
Perpetual futures trading involves several costs beyond funding. The table lists the main ones.
| Cost | What it is | Example |
|---|---|---|
| Taker fee | Charged when an order fills an existing order | 0.05% of $20,000 = $10 per side |
| Maker fee | Charged when an order adds to the order book | Often lower than the taker fee |
| Funding | Paid between longs and shorts | Can be a cost or income |
| Spread and slippage | Gap between expected and actual fill price | Larger on thin markets |
| Liquidation charges | Extra fees on forced closures | Binance lists insurance clearance fees |
Many exchanges use maker and taker fees. A maker order adds to the order book, while a taker order fills an order already there. Maker fees are often lower.
With a sample taker fee of 0.05%, opening a $20,000 position costs about $10. Closing it with another taker order costs about $10 more, for a total of about $20.
Fees are charged on the full position value, not on the margin. This means leverage raises fees as a share of the cash a trader puts in.
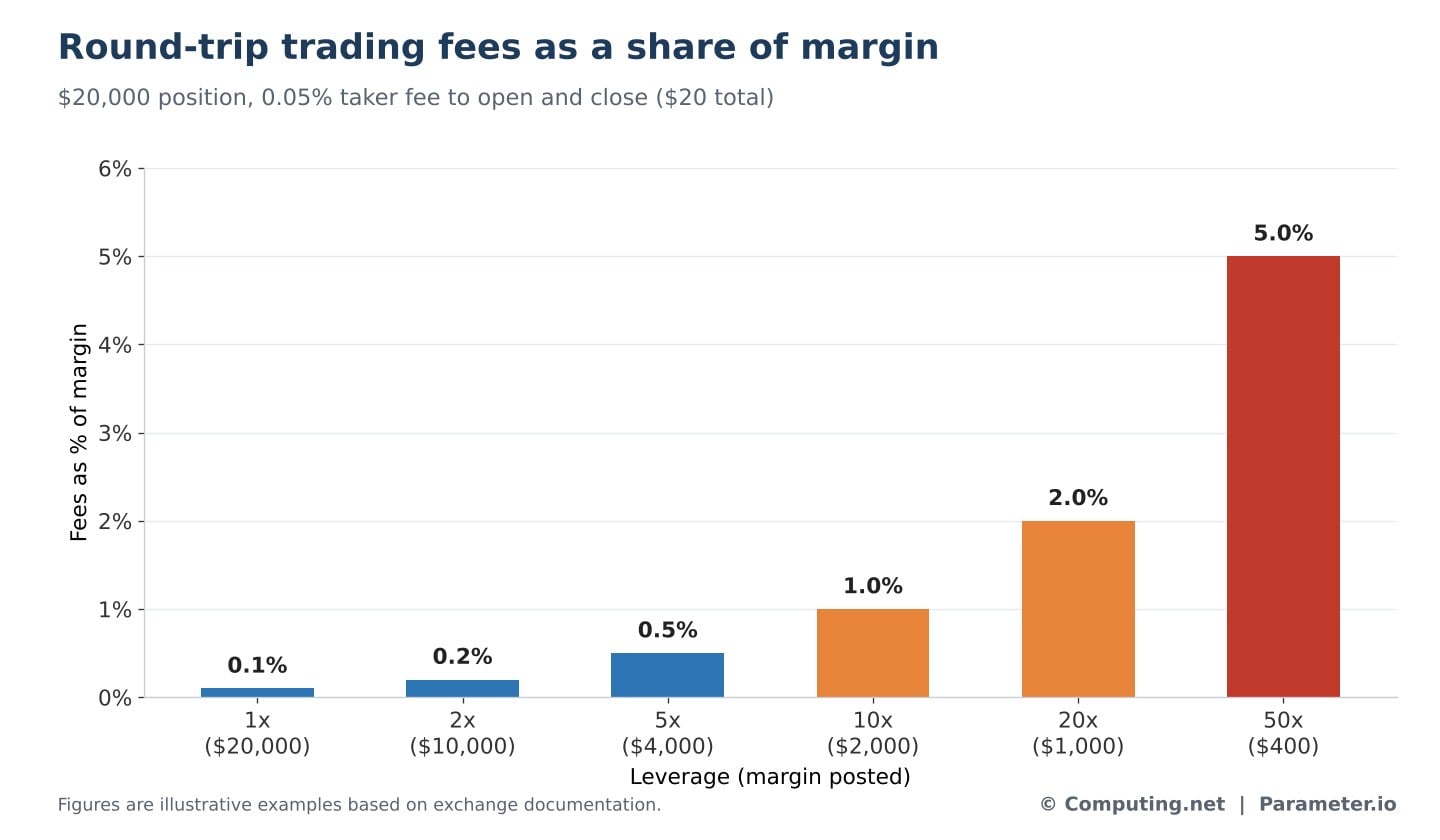
At 1x, the $20 in round-trip fees is 0.1% of the margin. At 20x, the margin is only $1,000, so the same fees take 2% of it. At 50x, they take 5%.
Spreads and slippage add to the bill. The spread is the gap between the best buy and sell prices. Slippage happens when an order fills at a worse price than expected.
What Funding Rates and Open Interest Show
Funding rates can hint at how traders are positioned. Strongly positive rates point to heavy demand for long positions. Strongly negative rates point to heavy demand for shorts.
Very high positive funding may suggest a crowded trade. If prices then fall, leveraged longs can be liquidated, which can push prices lower. This chain reaction is called a long squeeze.
A short squeeze works the other way. Rising prices force short traders out, and their buying can push prices higher.
Open interest counts the contracts that are still open. Rising open interest can show more activity in the market. It does not show whether traders are bullish or bearish, since every contract has both a long side and a short side.
Neither measure predicts prices on its own. Positive funding does not mean a fall is coming, and negative funding does not promise a rebound. Spot buying and selling, liquidity and economic news also move prices.
Margin Modes and Collateral Types
Exchanges usually offer two ways to manage collateral, and contracts differ by the asset used to back them. The table sums up the four common setups.
| Setting | How collateral works | Main risk |
|---|---|---|
| Isolated margin | Set amount assigned to one position | That position can still be liquidated |
| Cross margin | Positions share the account balance | One bad trade can drain other funds |
| Stablecoin-margined | USDT or USDC used as collateral | Stablecoin could lose its dollar peg |
| Coin-margined | A coin such as Bitcoin used as collateral | Collateral can fall with the trade |
Isolated margin sets aside a fixed amount for one position. If a trader puts $500 into a Bitcoin position, a bad trade mainly puts that $500 at risk, subject to platform rules.
Cross margin lets positions share the whole account balance. Gains elsewhere can support a losing trade, but one bad position can also drain money meant for other trades.
Coin-margined contracts carry an extra risk. A trader who is long Bitcoin with Bitcoin as collateral can see both the trade and the collateral lose value at the same time in a sharp fall.
Funding Rate Arbitrage in Numbers
Some traders try to collect funding instead of betting on price direction. A common setup is to buy Bitcoin on the spot market and open a short perpetual position of the same size.
When funding is positive, the short side receives payments from longs. The spot holding is meant to offset price moves in the short position.
On a $10,000 hedge with a rate of 0.01% every eight hours, the short would collect about $1 per period. That comes to about $3 a day and about $90 over 30 days.
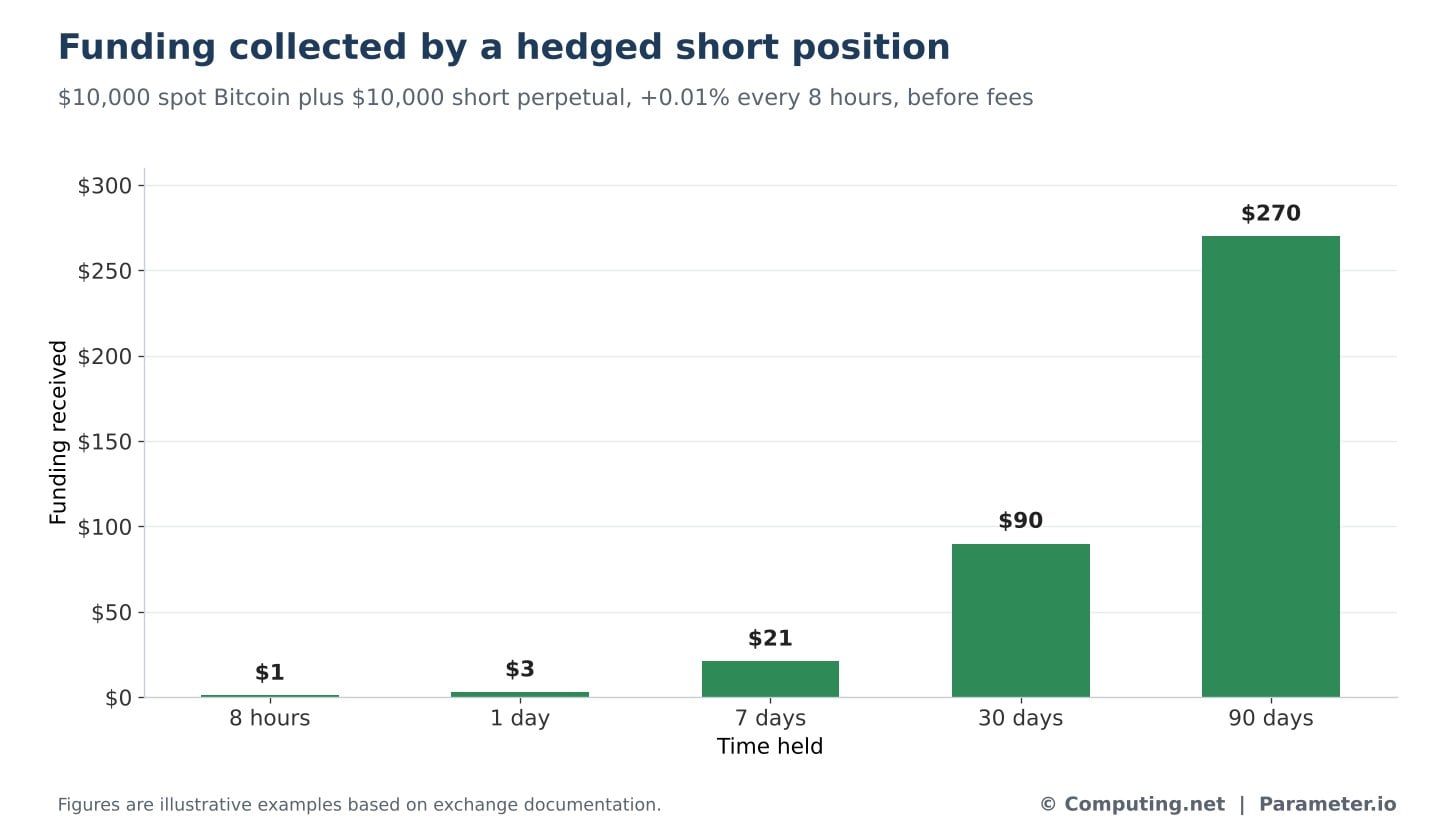
If that rate held for a full year, the total would be about $1,095, or close to 11% of the position. Rates rarely stay fixed for that long, and the figure is before fees.
The strategy is not risk-free. Funding can drop or turn negative, and traders still face fees, exchange risk and margin calls.
A gap between spot and futures prices can also cause short-term losses. If collateral runs low, the short position could even be liquidated. Binance describes this approach as funding rate arbitrage, but the word arbitrage does not mean guaranteed profit.
Main Risks and Regulation
Perpetual futures carry several risks that can make them a poor fit for new investors. The table lists the main ones.
| Risk | What it means |
|---|---|
| Leverage | Small price moves cause large losses compared with the margin |
| Liquidation | Positions can be closed by force before the market recovers |
| Funding | Payments build up over time and rates can change fast |
| Exchange and counterparty | Outages, hacks, cash problems or withdrawal limits |
| Smart contract | Decentralised platforms face code bugs and faulty price feeds |
| Liquidity | Wide spreads and slippage on less traded contracts |
| Regulatory | Rules and product access differ by country |
Rules for these products differ across countries. In February 2026, the European Securities and Markets Authority (ESMA) warned that some leveraged products sold as perpetual futures may fall under existing rules for contracts for difference.
Where those rules apply, they can include leverage limits, margin close-out protections and negative balance protection. In the United States, the CFTC and the National Futures Association have both warned that crypto derivatives carry high volatility and larger financial risks.
Are Perpetual Futures Suitable for Beginners?
For most beginners, perpetual futures are more complex than buying and holding coins. A correct price forecast does not guarantee a profitable trade.
A trader might rightly expect Bitcoin to rise over the next month. If the price drops sharply first, a leveraged long could be liquidated before the rise happens.
Basic safeguards include using low leverage, knowing the liquidation price and tracking funding costs. Keeping position sizes small and practicing in a simulated account first can also help. These steps reduce risk but cannot remove it.
Key Terms Explained
The terms below come up often in perpetual futures trading. Exact definitions can vary by platform, so traders should check their exchange’s own rules.
| Term | Meaning |
|---|---|
| Perpetual futures | Derivative contracts with no fixed end date |
| Long position | Gains when the contract price rises |
| Short position | Gains when the contract price falls |
| Leverage | Controlling a larger position with less cash |
| Initial margin | Collateral needed to open a position |
| Maintenance margin | Minimum equity needed to keep a position open |
| Funding rate | Rate that sets payments between longs and shorts |
| Mark price | Reference price used for margin and liquidation |
| Liquidation | Forced cut or closure of a position |
| Open interest | Contracts that are still open |
| Maker fee | Fee for adding orders to the order book |
| Taker fee | Fee for filling existing orders |
| Slippage | Gap between the expected and actual trade price |
Final Thoughts
Perpetual futures give traders a flexible way to follow crypto prices without owning coins. Funding payments help keep contract prices close to the spot market.
The numbers show the trade-offs clearly. A 0.03% funding rate can cost $1,350 a month on a $50,000 position, and a 1% move can wipe out the margin at 100x leverage.
Funding rates and open interest can offer clues about the market, but they do not predict prices. Exchange security, liquidity, collateral and local rules also shape the risk.
The most important question is not how much a position could earn. It is how much could be lost if the market moves the wrong way.
Sources
- Binance: Introduction to Futures Funding Rates
- Coinbase: Perpetual Futures Funding Specifications
- Deribit: Funding Specifications
- Binance: What Fees Are Generated in Futures Trading?
- US Commodity Futures Trading Commission: Understand the Risks of Virtual Currency Trading
- European Securities and Markets Authority: ESMA Reminds Firms of Their Obligations Under CFD Product Intervention Measures
- National Futures Association: Investor Advisory on Virtual Currency
- Coinbase: Perpetual Futures Funding Examples
Disclaimer: This article is for information only and is not financial or investment advice. Crypto derivatives are complex and risky. Leverage can lead to the loss of all trading capital and, with some products, losses larger than the first deposit.


