



Crypto markets never close. Bitcoin, Ethereum and thousands of other coins trade every hour of every day, including nights, weekends and holidays.
That makes it hard for any one person to watch prices all the time. Crypto trading bots are software programs built to do that job for them.
This article looks at the numbers behind these bots. It covers how they work, what they cost, how fees cut into returns and how scams use bot claims to draw in victims.
Most figures below are worked examples based on guides from exchanges and warnings from US regulators. They show how the math works. They do not predict what any single bot will earn.
Crypto Trading Bot Statistics: Markets That Never Close
A crypto trading bot is a program that buys and sells coins by following set rules. For example, a user might tell a bot to buy Bitcoin when its price falls below a moving average and sell when it rises above another level.
Once switched on, the bot watches the market and places orders when its rules are met. It can run day and night, as long as the exchange and the bot’s own systems stay online.
Crypto markets are open 168 hours a week. A regular trading session on a major US stock exchange runs 6.5 hours a weekday, or 32.5 hours a week.
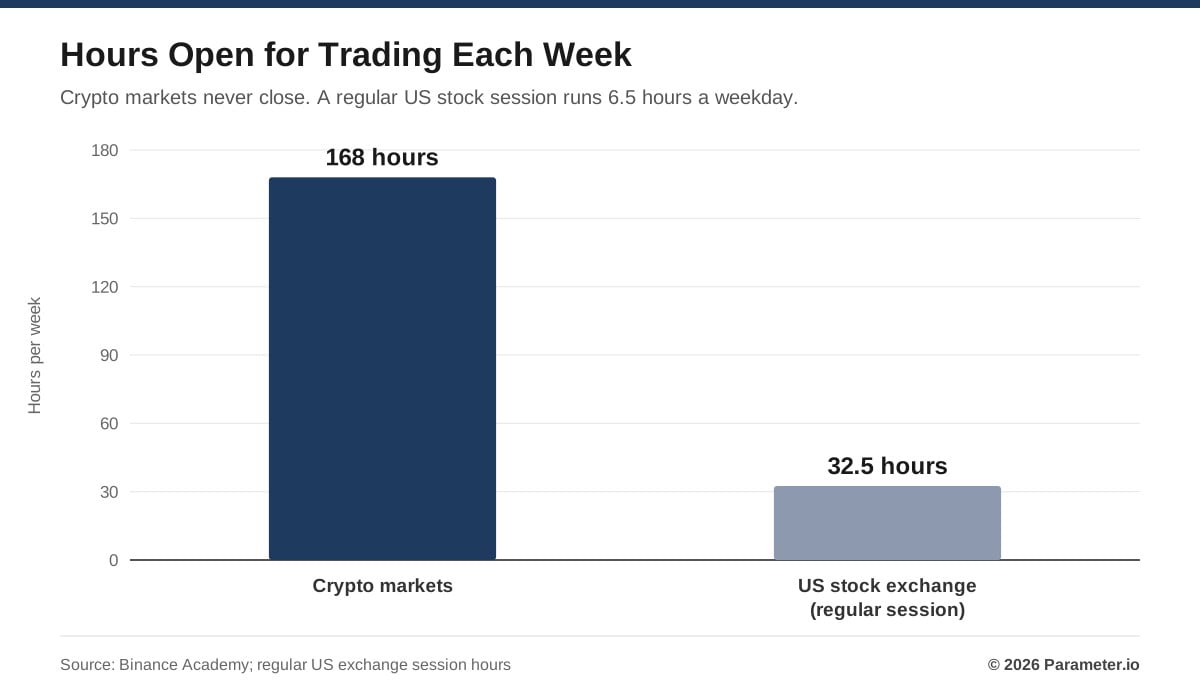
That means crypto trades for more than five times as many hours as stocks do in a normal week. Big price swings can happen at 3 a.m. or on a Sunday, which is one reason bots have become popular.
Binance Academy says bots can follow fixed rules or use machine learning models that adapt over time. It also says their profits still depend on market conditions and on good risk management.
In short, a bot is a tool for placing trades. Its results depend on the strategy it follows.
How a Bot Makes a Trade
Most bots follow the same five basic stages.
| Stage | What Happens |
|---|---|
| 1. Collect data | The bot pulls prices, trading volume, order book depth and technical indicators from an exchange. |
| 2. Analyse | It compares that data against the rules of its strategy. |
| 3. Signal | When the rules are met, it decides to buy, sell or close a position. |
| 4. Execute | It sends a market order, limit order or other order type to the exchange. |
| 5. Monitor | It keeps watching open positions and may adjust or close orders. |
Many bots connect to exchanges through an application programming interface, or API. Coinbase’s Advanced Trade API, for example, lets outside apps get live market data and place orders on a user’s account.
The Main Types of Trading Bots
| Bot Type | Strategy | Main Advantage | Main Risk |
|---|---|---|---|
| Grid trading | Buys and sells at set price levels | Automates range trading | Strong price trends |
| DCA bot | Buys a fixed amount on a schedule | Simple, steady buying | Long market declines |
| Arbitrage bot | Uses price gaps between exchanges | Targets small price differences | Fees, delays and failed orders |
| Trend following | Trades in the direction of a trend | Can capture big moves | False signals |
| Scalping bot | Makes many very short trades | Targets tiny price changes | High trading costs |
| Rebalancing bot | Keeps a set portfolio mix | Automates diversification | Costs and taxes |
| AI trading bot | Uses predictive or adaptive models | Handles complex data | Model errors and overfitting |
Each type behaves differently as markets change. A bot that does well when prices move sideways can lose money when prices trend hard in one direction.
Grid Trading Bot Statistics: Small Gains and Fee Impact
A grid bot places a ladder of buy and sell orders inside a set price range. It aims to profit each time the price moves up and down between those levels.
Binance says spot grid trading is best suited to markets that move back and forth inside a range. The bot buys a little as prices fall and sells a little as they rise.
Here is an example. Bitcoin trades at $80,000, and a user sets a grid from $75,000 to $85,000.
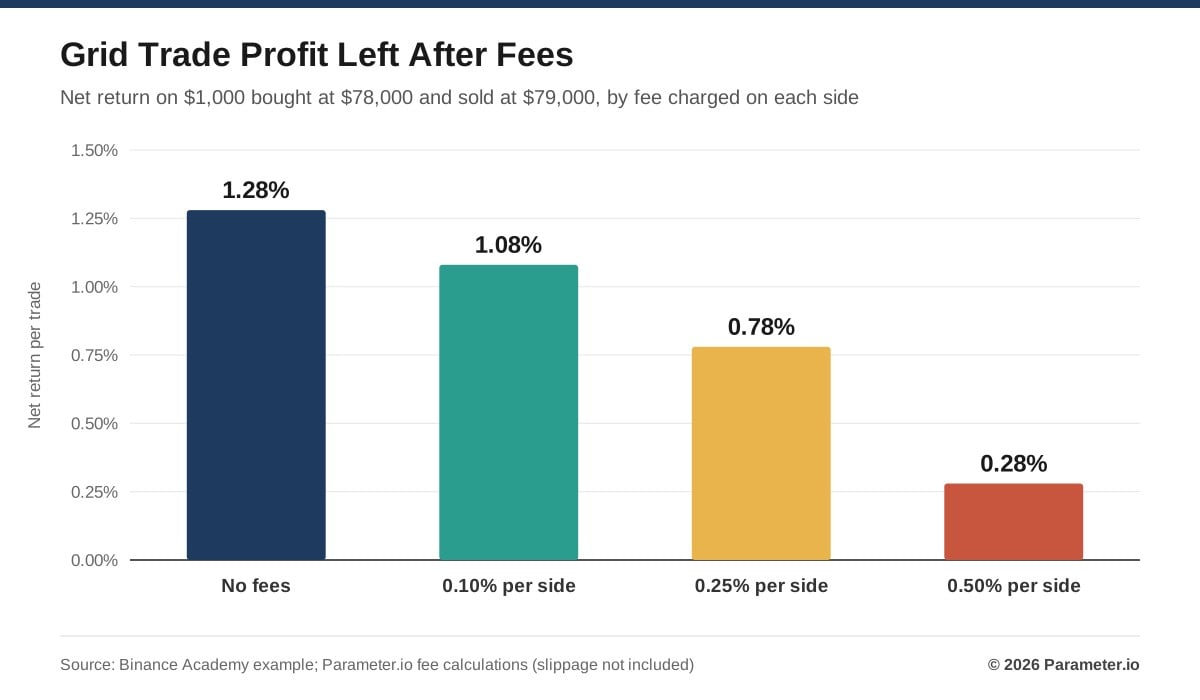
The bot buys $1,000 of Bitcoin at $78,000 and later sells it at $79,000. The gross gain is about $12.82, or 1.28%, before fees and slippage.
Every buy and every sell has a fee. The chart below shows how much of that 1.28% gain is left at four sample fee levels.
| Fee on Each Side | Net Gain on $1,000 | Net Return |
|---|---|---|
| 0% | $12.82 | 1.28% |
| 0.10% | $10.81 | 1.08% |
| 0.25% | $7.79 | 0.78% |
| 0.50% | $2.76 | 0.28% |
At a 0.5% fee on each side, about 78% of the gross profit goes to fees. These figures leave out slippage, which can lower the result further.
What Happens When Price Leaves the Range
The bigger risk is a strong trend. If Bitcoin falls below $75,000, the bot may be left holding coins that keep losing value.
If Bitcoin climbs above $85,000, the bot may have sold its coins too early. In that case, a person who simply held Bitcoin would likely have done better.
This is why a screen full of winning grid trades can mislead. Grid profits should always be checked against the current value of any coins the bot has not yet sold.
Dollar-Cost Averaging Bot Statistics
A dollar-cost averaging bot, or DCA bot, buys a fixed dollar amount at set times. A user might set it to buy $100 of a coin each month, no matter what the price is.
The table below shows four months of $100 purchases.
| Month | Price | Amount Invested | Tokens Bought |
|---|---|---|---|
| January | $100 | $100 | 1.00 |
| February | $80 | $100 | 1.25 |
| March | $50 | $100 | 2.00 |
| April | $100 | $100 | 1.00 |
| Total | $400 | 5.25 |
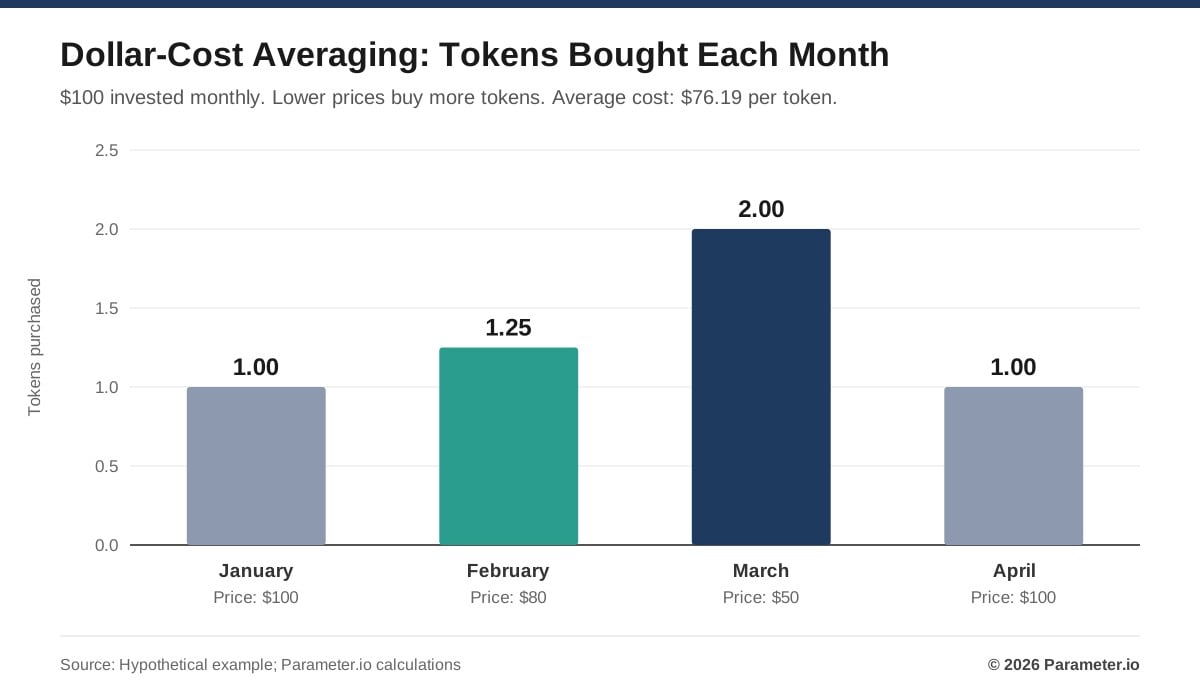
The investor spent $400 and got 5.25 tokens. That is an average cost of about $76.19 per token, before fees.
The simple average of the four monthly prices is $82.50. The average cost is lower because the same $100 buys more tokens when the price is low, such as the 2 tokens bought in March.
At April’s price of $100, the 5.25 tokens are worth $525. That is a gain on paper of $125, or 31.25%.
DCA does not protect against a long decline. If the price fell to $30, the holding would be worth $157.50, a loss of $242.50, or about 61%.
Fixed Buys vs Growing Buys
Some platforms also use the DCA label for bots that buy larger amounts after each price drop. This approach is sometimes called a Martingale-style strategy.
During a long bear market, these bots can build up a very large position. The danger grows when the bot uses borrowed money, known as leverage.
For beginners, fixed-amount buys on a set schedule are easier to understand and manage.
Arbitrage Bot Statistics: How a $120 Gap Shrinks
Arbitrage bots try to profit from price gaps between exchanges. The idea is to buy where a coin is cheaper and sell where it costs more, at the same time.
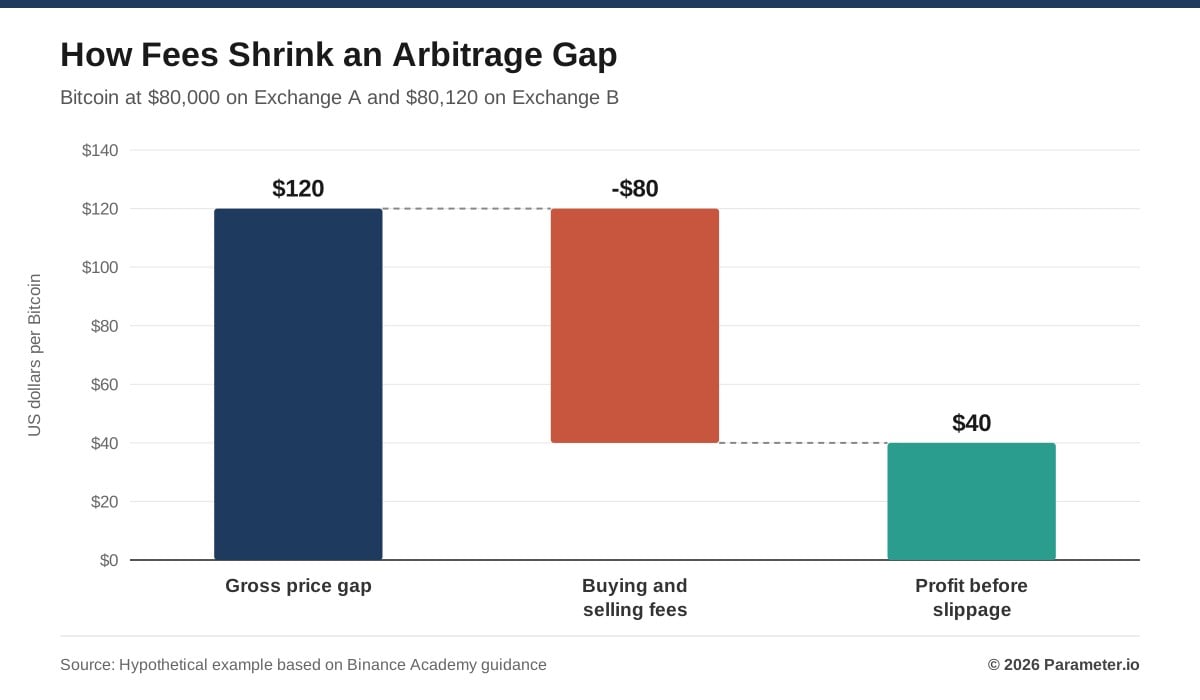
Suppose Bitcoin trades at $80,000 on Exchange A and $80,120 on Exchange B. The gross gap is $120.
If buying and selling fees total $80, only $40 is left. Slippage, which is the gap between the expected price and the price actually paid, could cut it further.
| Item | Amount |
|---|---|
| Price on Exchange A | $80,000 |
| Price on Exchange B | $80,120 |
| Gross price gap | $120 |
| Buying and selling fees | -$80 |
| Profit before slippage | $40 |
| Return on $80,000 purchase | 0.05% |
In this example, fees take two-thirds of the price gap. The $40 that remains is a return of 0.05% on the $80,000 purchase.
If prices move back together before both orders fill, the trade can lose money. The profit only exists if both sides go through at the expected prices.
Why Price Gaps Close Fast
Professional trading firms compete to find and close these gaps. As a result, good chances can vanish within moments.
Moving coins between exchanges can also bring withdrawal limits, delays and network fees. To avoid that, some bots keep money on several exchanges at once, which adds the risk that one of those platforms fails.
Arbitrage is often called low risk. In practice, failed orders and sudden price moves can still lead to losses.
Trading Bot Returns vs Buy and Hold
Bots can make money. But the profit shown on a bot’s dashboard is often not the profit an investor keeps.
Here is a sample case. A trader puts $5,000 into a bot that earns a gross return of 12% over six months, or $600.
| Item | Amount |
|---|---|
| Gross trading profit | $600 |
| Trading commissions | -$120 |
| Slippage and spreads | -$80 |
| Bot subscription | -$150 |
| Total costs | -$350 |
| Net profit before tax | $250 |
The net profit before tax is $250, a return of 5%. Costs took about 58% of the gross profit.
Now compare that with simply buying and holding. If Bitcoin rose 20% over the same six months, $5,000 held in Bitcoin would have gained about $1,000.
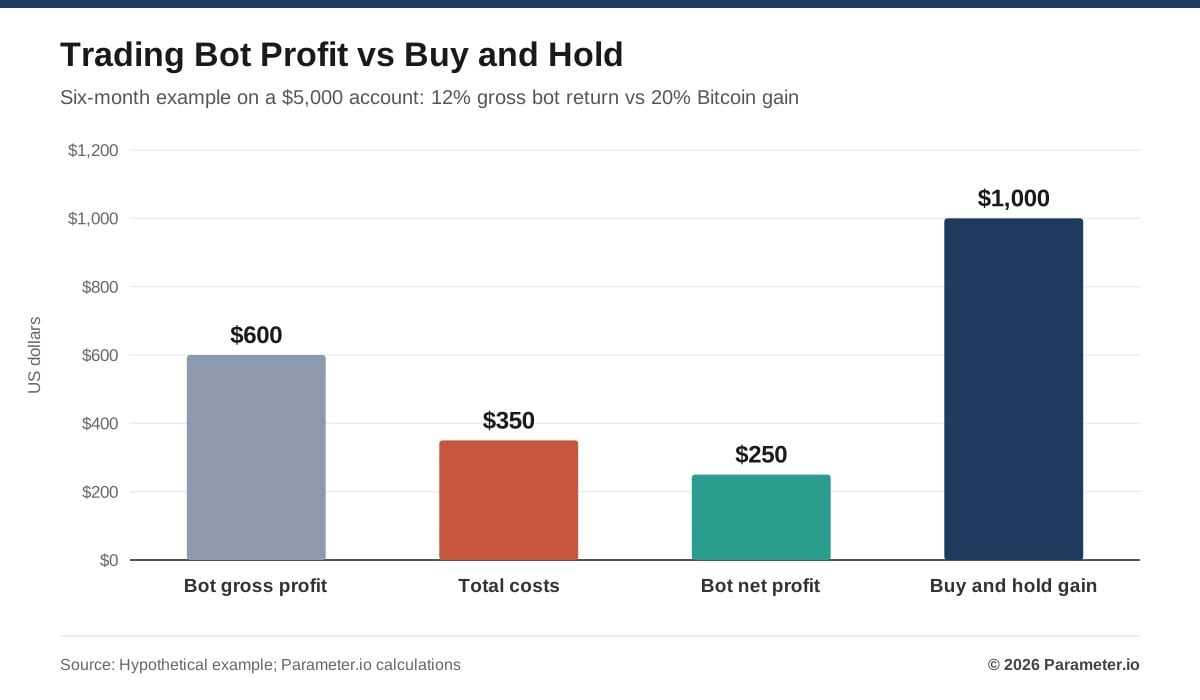
In this case, the bot’s net profit was one-quarter of the buy-and-hold gain. The bot made money but still trailed the simpler choice by $750.
These numbers are an example, not a forecast. In a sideways or falling market, a bot could beat buy and hold.
The lesson is about how to judge results. A bot should be compared against a simple benchmark after all costs are counted.
How Much Crypto Trading Bots Cost
Some exchanges offer built-in bots with no extra subscription. Outside providers often charge monthly fees, performance fees or extra charges for advanced tools.
A free bot does not mean free trading. Every order still carries exchange fees, and every order can face spreads and slippage.
Subscription costs weigh most on small accounts. A $30 monthly plan costs $360 a year.
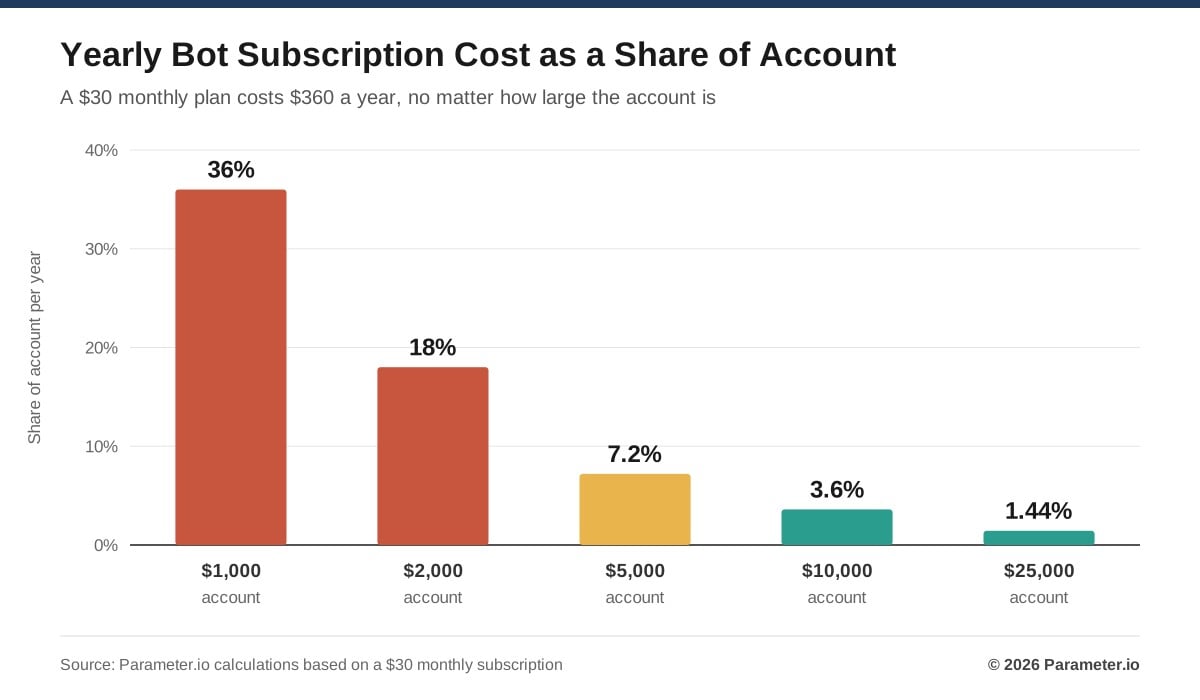
| Account Size | Yearly Subscription | Cost as Share of Account |
|---|---|---|
| $1,000 | $360 | 36% |
| $2,000 | $360 | 18% |
| $5,000 | $360 | 7.2% |
| $10,000 | $360 | 3.6% |
| $25,000 | $360 | 1.44% |
On a $2,000 account, the bot would need to earn 18% a year just to cover its subscription. That is before any trading fees.
On a $25,000 account, the same plan costs 1.44% a year. The fee stays the same, so its weight falls as the account grows.
Other Costs to Count
Fast trading strategies can make hundreds or thousands of trades. Even small fees add up quickly at that pace.
Spreads and slippage tend to be larger for smaller coins with fewer buyers and sellers. Some users also pay for market data, server hosting and funding payments on futures positions.
All of these should be included when checking whether a bot is worth its price.
Win Rate, Backtesting and AI Bot Statistics
Bot sellers often advertise a high win rate. A win rate alone can hide a losing strategy.
Take a bot that wins 80% of its trades. Over 100 trades, it makes $10 on each of 80 wins, for $800 in gains.
It loses $100 on each of the other 20 trades, for $2,000 in losses. Even with an 80% win rate, the bot is down $1,200 before fees.
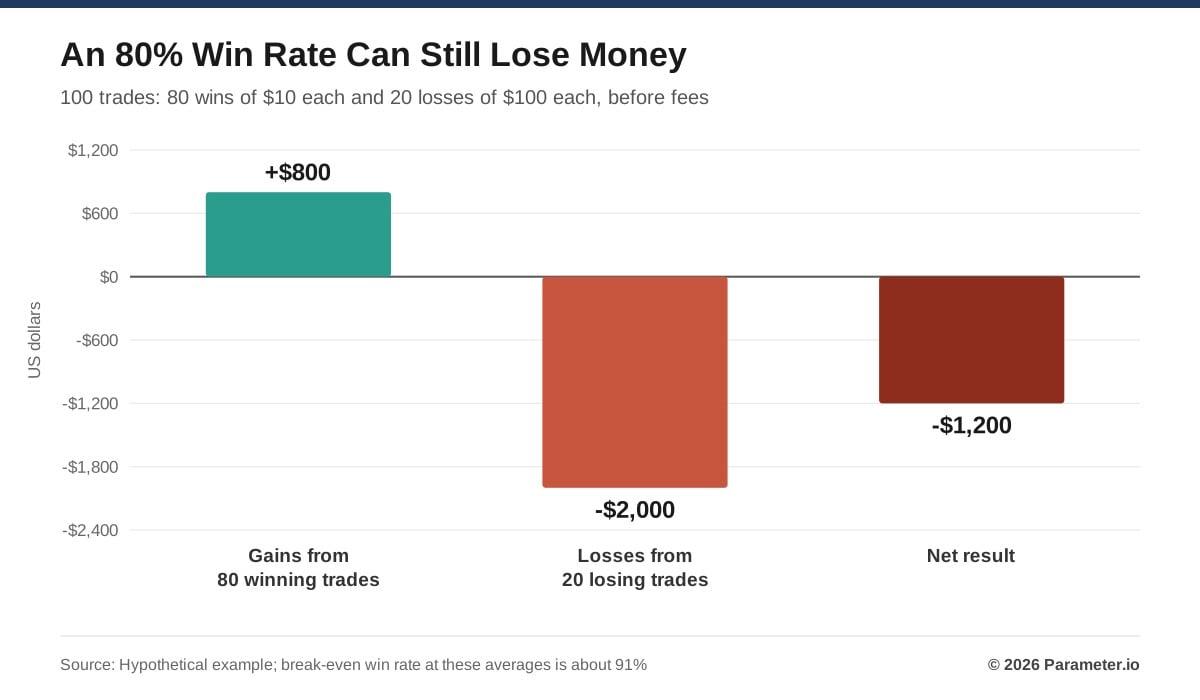
With those average gains and losses, the bot would need to win about 91% of its trades just to break even. That is why average gain, average loss and the largest drop in account value, called maximum drawdown, matter more than the headline win rate.
The questions below can help when judging any bot.
| Question | Why It Matters |
|---|---|
| Is the strategy easy to understand? | Reduces reliance on claims that cannot be checked |
| Has it been tested in rising, falling and sideways markets? | Shows weak spots |
| Can someone else check the results? | Helps judge whether claims are real |
| What are the total costs? | Decides the net profit |
| Does it use leverage? | Adds the risk of forced liquidation |
| Does it beat a simple benchmark? | Tests whether the extra effort is worth it |
| Can it be stopped right away? | Supports risk control |
The Limits of Backtesting
Backtesting runs a strategy on past price data to see how it would have done. It can catch problems early, such as a bot that trades so often that fees wipe out its gains.
Backtests have weak points. Overfitting happens when settings are tuned until past results look great, but the pattern was just random noise.
Look-ahead bias happens when a test uses information that would not have been known at the time. Many backtests also assume trades fill at prices that were not really available.
Paper trading, or running a bot with pretend money, is a useful next step. It still cannot copy real problems such as partial fills and exchange delays.
Trend and AI Bots
Trend-following bots buy when prices start moving up, for example when a 20-day moving average crosses above a 50-day average. In sideways markets, they can get caught in repeated false signals, known as whipsaws.
AI bots use machine learning to study prices, trading volume and news. A model that worked in one period can fail when conditions change.
The US Commodity Futures Trading Commission (CFTC) warns that AI will not turn trading bots into money machines. Calling a bot AI-powered says little about whether it will make money.
Crypto Bot Security and Scam Statistics
Most outside bots connect to an exchange with an API key. This key works like a pass that lets the software see an account and place orders.
The permissions on that key matter. A stolen key with too much access could let an attacker place trades the owner never approved.
| API Permission | Does a Typical Trading Bot Need It? |
|---|---|
| View balances and orders | Usually yes |
| Place and cancel trades | Yes |
| Withdraw funds | No, keep it turned off |
| IP address limits | Recommended where offered |
Kraken advises users to limit permissions, keep keys secure and delete keys they no longer use. It also warns that anyone who gets a key with enough access could take sensitive actions on an account.
Two-factor authentication on both the exchange and the bot account adds another layer of protection. Even with withdrawals turned off, a stolen key could still be used to place harmful trades.
The Scale of Bot Fraud
Fake trading bots are a common tool for fraud. The CFTC points to Mirror Trading International as one example.
According to the regulator, the scheme involved about 23,000 victims and more than $1.7 billion worth of Bitcoin. Promoters claimed their trading software would deliver steady returns, but customer money was taken rather than invested.
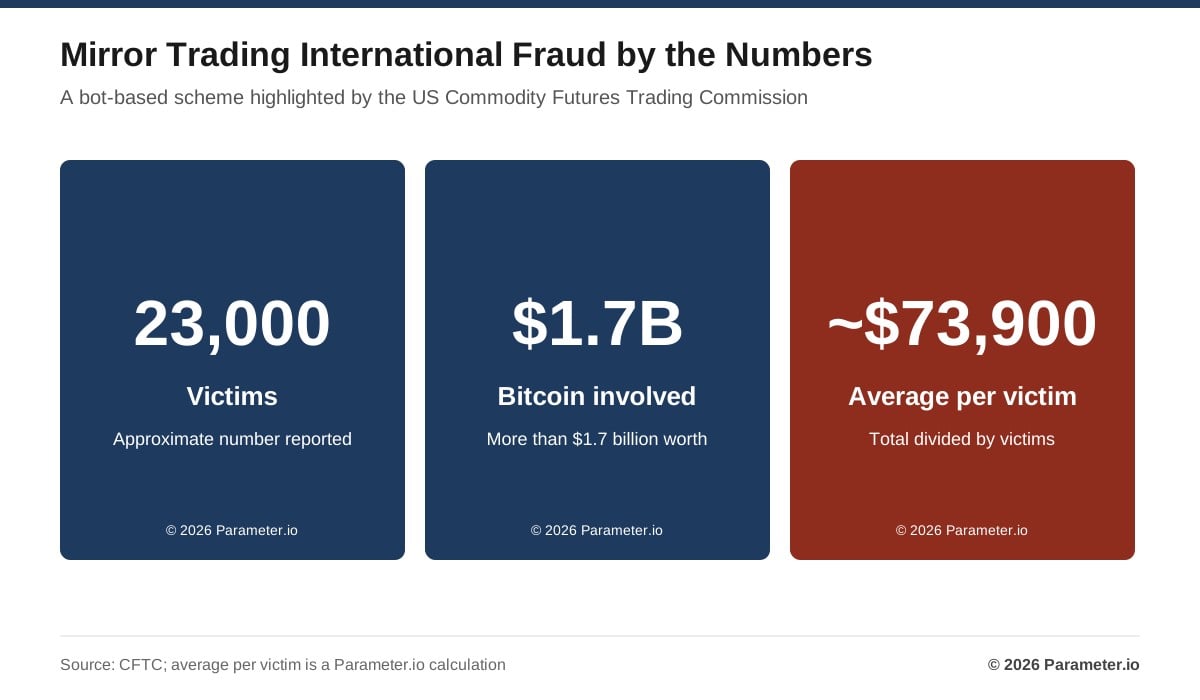
Spread across all victims, that works out to roughly $73,900 per person on average. Actual losses varied from person to person.
The SEC and CFTC have also issued a joint warning about fake crypto trading websites. Red flags include promises of guaranteed or fixed daily returns, very high win rates, refusal to explain the strategy and requests to deposit money straight into an unknown platform.
What the Numbers Mean for Investors
Bots and manual trading each have strengths. The table below compares them side by side.
| Feature | Trading Bots | Manual Trading |
|---|---|---|
| Market watching | Can run around the clock | Needs the trader to be available |
| Consistency | Follows set rules | Shaped by human choices |
| Emotion | Reduced when placing trades | Can be strong |
| Flexibility | Limited by settings | Can react to new information |
| Main risk | Software and API failures | Human error |
| Profit guarantee | None | None |
Neither approach comes with a profit guarantee. A losing strategy stays a losing strategy no matter how steadily a bot runs it.
For beginners, simple automation is usually the easier place to start. A DCA bot that buys a fixed amount on a schedule removes the need to time the market.
Rebalancing bots are another simple option. If a portfolio set at 60% Bitcoin and 40% Ethereum drifts to 70% and 30%, the bot sells some Bitcoin and buys Ethereum to restore the mix.
Trading costs and taxes can reduce the benefit of rebalancing. Leveraged futures bots, fast scalping bots and any service promising guaranteed daily profits carry much higher risk.
Anyone trying a bot can start with a small amount they can afford to lose and avoid leverage at first. It also helps to set clear rules for switching the bot off, such as a large drawdown, trades that look wrong or an exchange outage.
The numbers in this article point to one main finding. A bot’s value depends on what it earns after fees, risks and time, not on how many trades it makes or how advanced it sounds.
Disclaimer: This article is for information only and is not financial or investment advice. Crypto trading carries a high level of risk, including the loss of all money invested. Automated trading systems do not guarantee profits, and past results do not predict future results.
Sources
- Binance Academy: What Are Crypto Trading Bots and How Do They Work?
- Binance Academy: Your Guide to Binance Trading Bots
- CFTC: AI Won’t Turn Trading Bots Into Money Machines
- Kraken: API Key Security
- Coinbase: Advanced Trade API
- CFTC and SEC: Watch Out for Fraudulent Digital Asset and Crypto Trading Websites
- Coinbase: How to Create an API Key


