



Price charts show where a cryptocurrency has traded. They do not show what happens when someone tries to buy or sell a large amount right now.
A token might show a price of $1. Buying $50,000 worth of it could still push the average price paid well above that figure.
An investor holding a large position can face the same problem in reverse. Selling it all at once may mean accepting prices well below the last quote.
The reason is market depth. This article uses worked examples and guidance from Coinbase, Kraken and CME Group to show how depth, spreads and slippage affect what traders really pay.
| Measure | Example figure |
|---|---|
| Bitcoin bid-ask spread | $20, or 0.025% of the midpoint |
| Small token bid-ask spread | $0.10, or 10% of the midpoint |
| Loss from buying and selling at once with a 10% spread | About 9.52%, before fees |
| Slippage on a 5,000-token purchase | 3% |
| Extra cost of a 4 BTC purchase above the best ask | $11.25 per BTC, about 0.0141% |
| Order-book imbalance with $6M bids and $4M asks | +0.20 |
What Market Depth Measures
Market depth is the amount of buy and sell orders waiting at different prices on an exchange. It shows how much of an asset can be traded before the price starts to move.
A market with many orders close to the current price is called deep. A market with few orders is called shallow or thin.
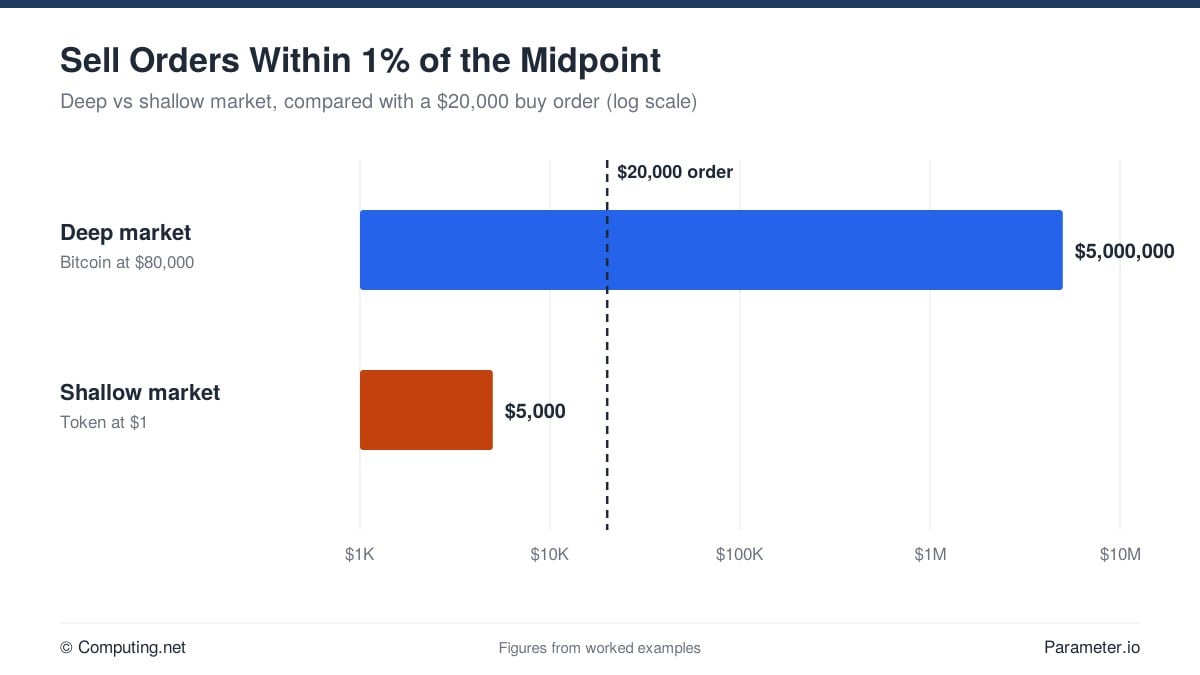
Take Bitcoin trading at $80,000 on an exchange that holds $5 million of sell orders within 1% above the midpoint. A trader buying $20,000 worth would use about 0.4% of that supply.
Now take a token priced at $1 with only $5,000 of sell orders within 1% of the midpoint. A $20,000 market buy is four times larger than that nearby supply, so it would push into higher-priced orders.
Kraken describes market depth as a core part of exchange liquidity. The main point is simple: a quoted price does not promise that anyone can trade a meaningful amount at that price.
| Deep market (Bitcoin) | Shallow market (small token) | |
|---|---|---|
| Price | $80,000 | $1 |
| Sell orders within 1% of midpoint | $5,000,000 | $5,000 |
| $20,000 order as a share of that supply | 0.4% | 400% |
| Likely result | Little price impact | Order moves into higher prices |
How a Crypto Order Book Is Laid Out
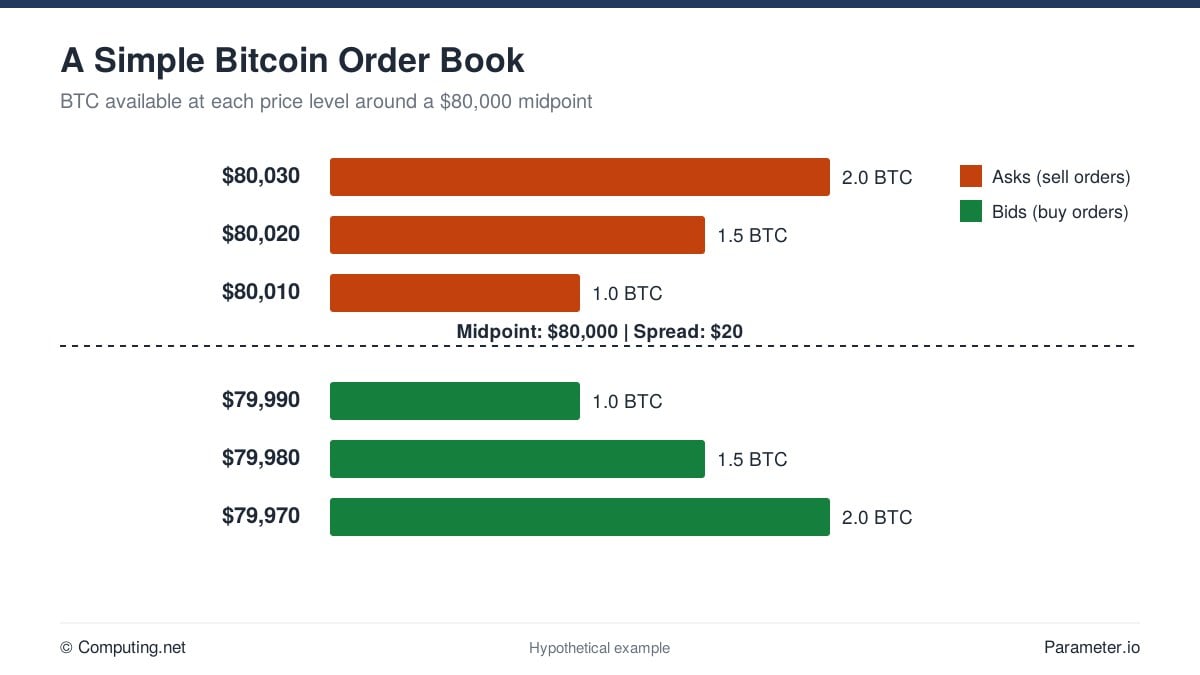
An order book is a live list of open buy and sell orders for one trading pair, such as BTC/USD or ETH/USDT. Coinbase describes it as a record of the prices people want to trade at and the amounts they are willing to trade.
Buy orders are called bids. Sell orders are called asks, and each row shows a price and the amount on offer.
| Side | Price | BTC available |
|---|---|---|
| Ask | $80,030 | 2.0 |
| Ask | $80,020 | 1.5 |
| Ask | $80,010 | 1.0 |
| Midpoint | $80,000 | |
| Bid | $79,990 | 1.0 |
| Bid | $79,980 | 1.5 |
| Bid | $79,970 | 2.0 |
Here the best ask is $80,010 and the best bid is $79,990. A market buy would start at $80,010, while a market sell would start at $79,990.
Only 1 BTC is offered at the best ask. A 0.5 BTC purchase could fill at that price, but a 3 BTC purchase would need orders at higher prices.
The book changes all the time as traders add, fill, change and cancel orders. Any view of it is a snapshot, not a promise of future demand.
Not every exchange works this way. Some decentralised exchanges use liquidity pools and automated market makers, where standard order-book measures do not apply.
Bid-Ask Spread Statistics
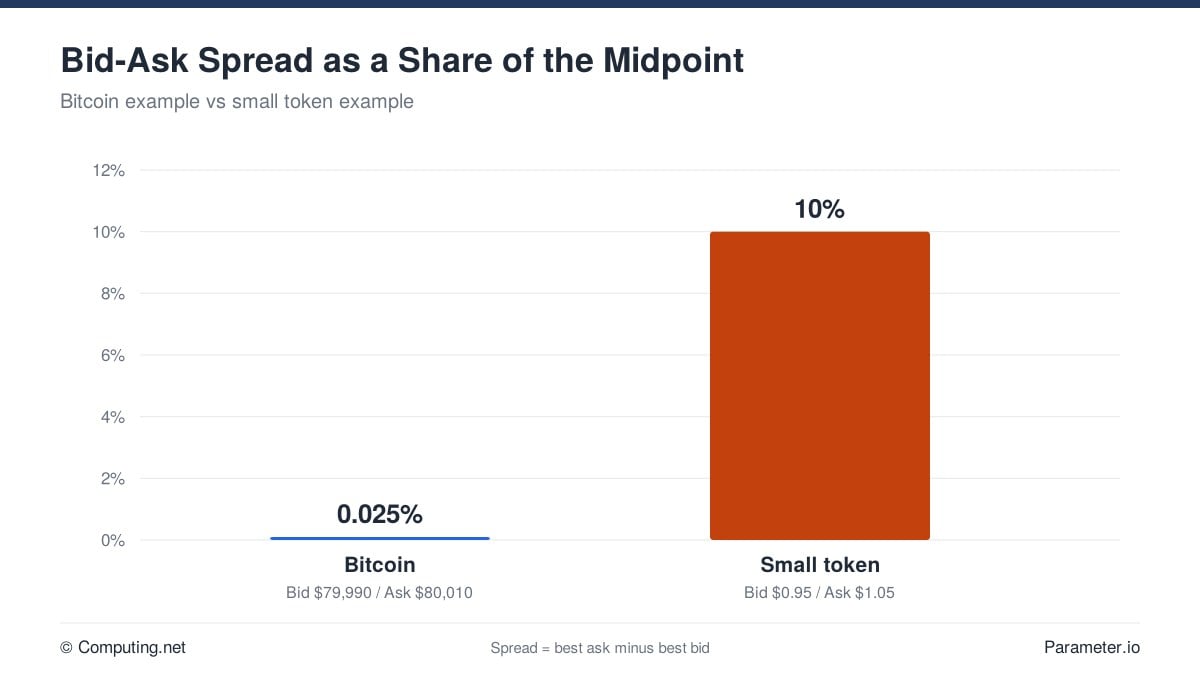
The spread is the gap between the best ask and the best bid. It is the cost of buying and then selling straight away, before any fees.
The formula is Best Ask minus Best Bid. To compare markets with different prices, divide the spread by the midpoint and show it as a percentage.
| Bitcoin example | Small token example | |
|---|---|---|
| Best bid | $79,990 | $0.95 |
| Best ask | $80,010 | $1.05 |
| Spread | $20 | $0.10 |
| Midpoint | $80,000 | $1.00 |
| Spread as % of midpoint | 0.025% | 10% |
| Loss from an instant buy and sell | About 0.025% | About 9.52% |
In the token example, a trader who buys at $1.05 and sells at once at $0.95 loses about 9.52% of the purchase price. That loss comes before commissions.
A narrow spread does not mean a market is deep. An exchange could show a 0.01% spread with very little crypto on offer at those prices.
The spread shows the cost of crossing the best prices. Depth shows how much can be traded before prices get worse, so traders need to check both.
Cumulative Depth and the 1% Depth Measure
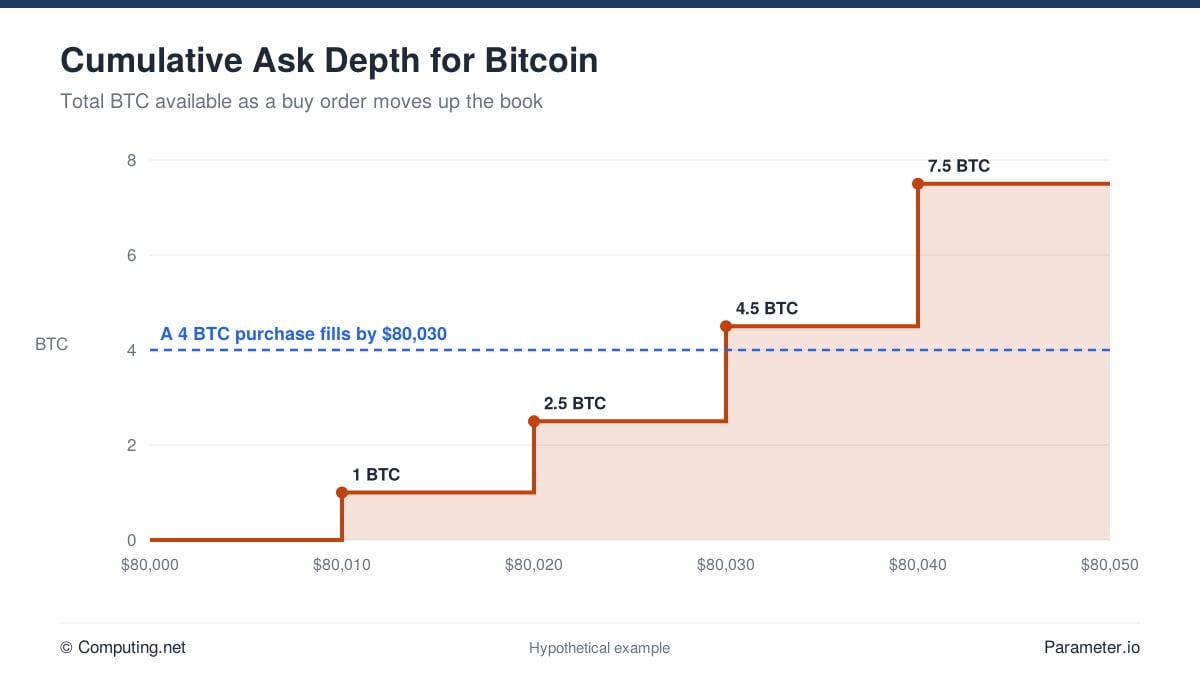
Cumulative depth adds up the orders across several price levels. It shows how much can be bought or sold as an order moves further from the best price.
| Ask price | BTC available | Cumulative BTC |
|---|---|---|
| $80,010 | 1.0 | 1.0 |
| $80,020 | 1.5 | 2.5 |
| $80,030 | 2.0 | 4.5 |
| $80,040 | 3.0 | 7.5 |
A trader buying 4 BTC from this book would use all of the first two levels and part of the third. The order would finish at $80,030, if the book stayed the same.
Analysts often measure depth within a set distance of the midpoint, such as 0.5%, 1% or 2%. This makes it easier to compare exchanges that use different price steps.
With Bitcoin at $80,000, the 1% band runs from $79,200 to $80,800. Bid depth is the buying interest in the lower half, and ask depth is the selling interest in the upper half.
Say an exchange holds $3 million of bids and $4 million of asks within 1%. Total 1% depth is $7 million, but a seller should look at the $3 million bid side and a buyer at the $4 million ask side.
Depth can also be shown in dollars. Ten BTC near $80,000 is about $800,000 of liquidity, which helps when comparing tokens with very different prices.
Depth Charts, Walls and Order-Book Imbalance
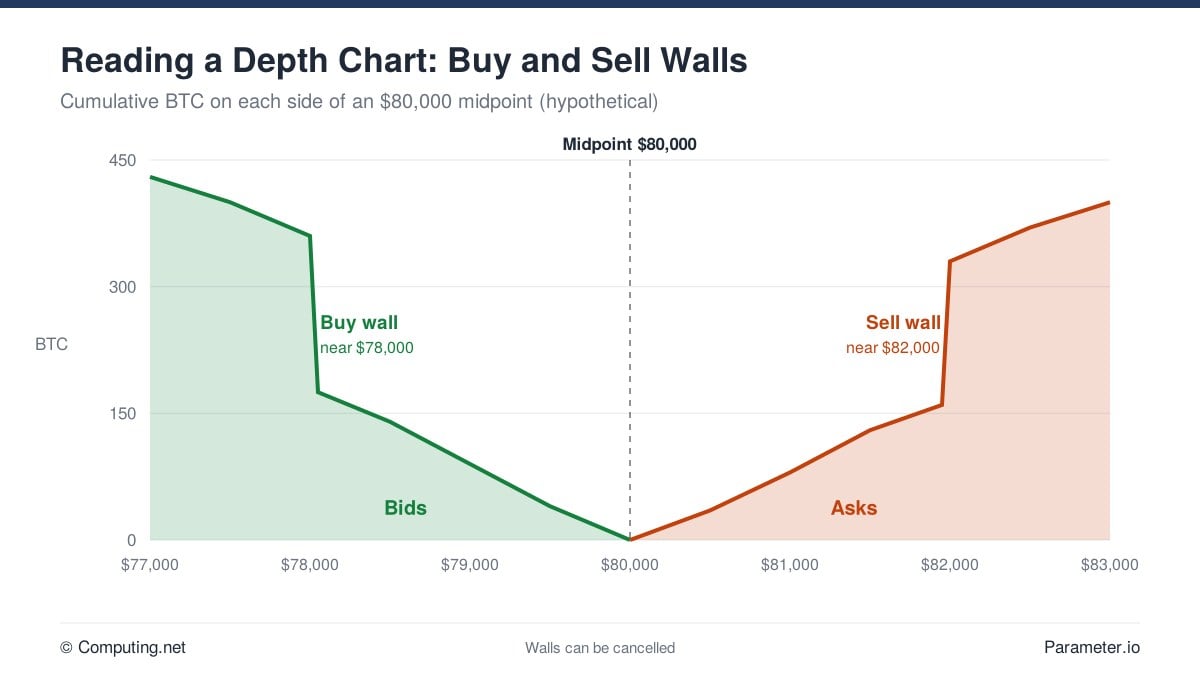
A depth chart draws the order book as two curves. Bids usually sit on the left and asks on the right, with price along the bottom and total order size up the side.
A steep rise shows many orders packed into a small price range. A flat stretch shows thin liquidity in that area.
Large clusters of orders are called walls. With Bitcoin at $80,000, a buy wall at $78,000 may be read as support, while a sell wall at $82,000 may be read as resistance.
Walls are not guaranteed. Orders can be cancelled before the price reaches them, and some walls reflect short-term market making rather than long-term intent.
Order-book imbalance compares the two sides. The formula is (Bid Depth minus Ask Depth) divided by (Bid Depth plus Ask Depth).
| Scenario | Bid depth | Ask depth | Imbalance | What it shows |
|---|---|---|---|---|
| A | $6 million | $4 million | +0.20 | More buying interest on display |
| B | $3 million | $7 million | -0.40 | More selling interest on display |
| C | $5 million | $5 million | 0.00 | Balanced book |
Imbalance describes the book at one moment. It is not a reliable forecast, because large orders can be pulled and market orders can change conditions fast.
The result also depends on the price range chosen. A reading within 0.5% of the midpoint can look very different from one within 2%.
Slippage and Average Execution Price
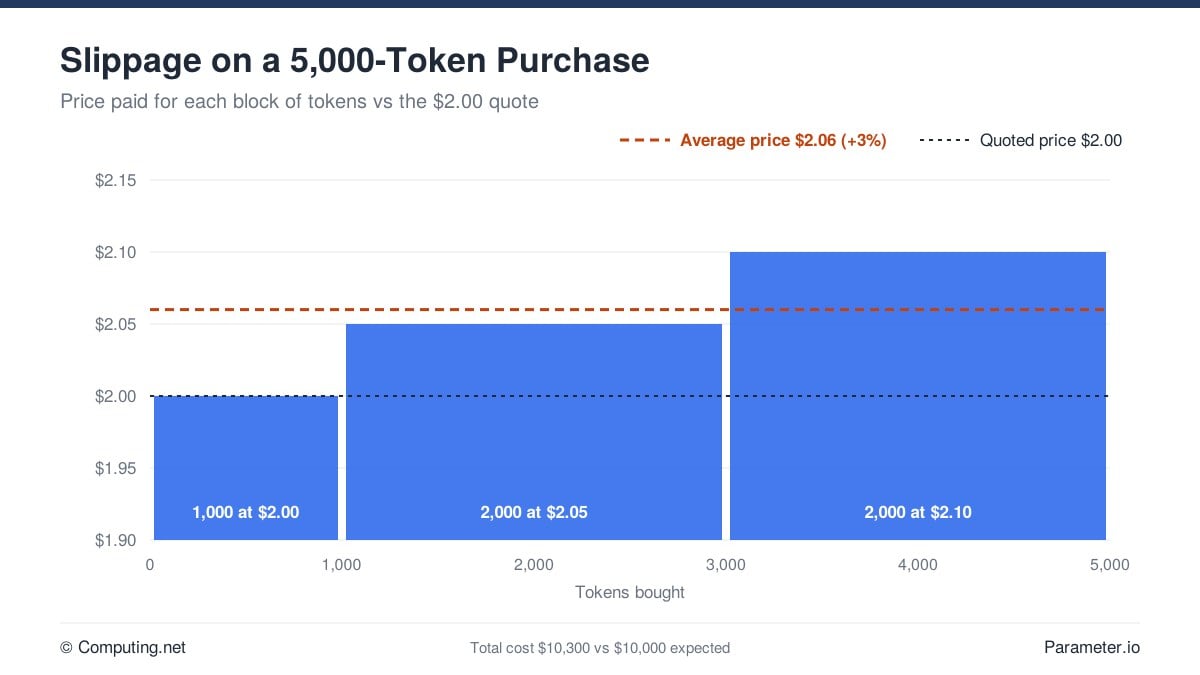
Slippage is the gap between the expected price and the average price actually paid or received. It happens when an order is larger than the supply at the best price, or when the market moves during the trade.
Take a token trading near $2. A trader wants 5,000 tokens and expects to pay $10,000, but only 1,000 tokens are on offer at $2.
| Tokens bought | Price | Cost |
|---|---|---|
| 1,000 | $2.00 | $2,000 |
| 2,000 | $2.05 | $4,100 |
| 2,000 | $2.10 | $4,200 |
| 5,000 | $10,300 |
The trader pays $10,300, an average of $2.06 per token. That is 3% more than the $2 quote.
The average execution price is total value divided by total quantity. The same method works for a 4 BTC purchase.
| Quantity | Price | Value |
|---|---|---|
| 1 BTC | $80,010 | $80,010 |
| 1.5 BTC | $80,020 | $120,030 |
| 1.5 BTC | $80,030 | $120,045 |
| 4 BTC | $320,085 |
The average of $80,021.25 is $11.25 above the best ask, or about 0.0141%. In the deep Bitcoin book the cost of moving through levels is small, while in the thin token book it is much larger.
These examples leave out fees and assume the book stays still. In real markets, orders can appear or vanish while a trade fills.
Order type also affects slippage. Coinbase notes that a market order can fill at several prices and that the first quote is not guaranteed for the whole trade.
| Feature | Market order | Limit order |
|---|---|---|
| Main goal | Fast execution | Price control |
| Uses existing orders | Yes | Sometimes |
| Adds liquidity to the book | No | Yes |
| Slippage risk | Can be large | Capped by the set price |
| Fill guaranteed | Not always | No |
| Usual fee type | Taker | Maker or taker |
For a small trade in a deep market, a market order may be fine. For larger trades or thin markets, a limit order sets a worst acceptable price, though it may not fill if the market moves away.
Market Depth vs Trading Volume
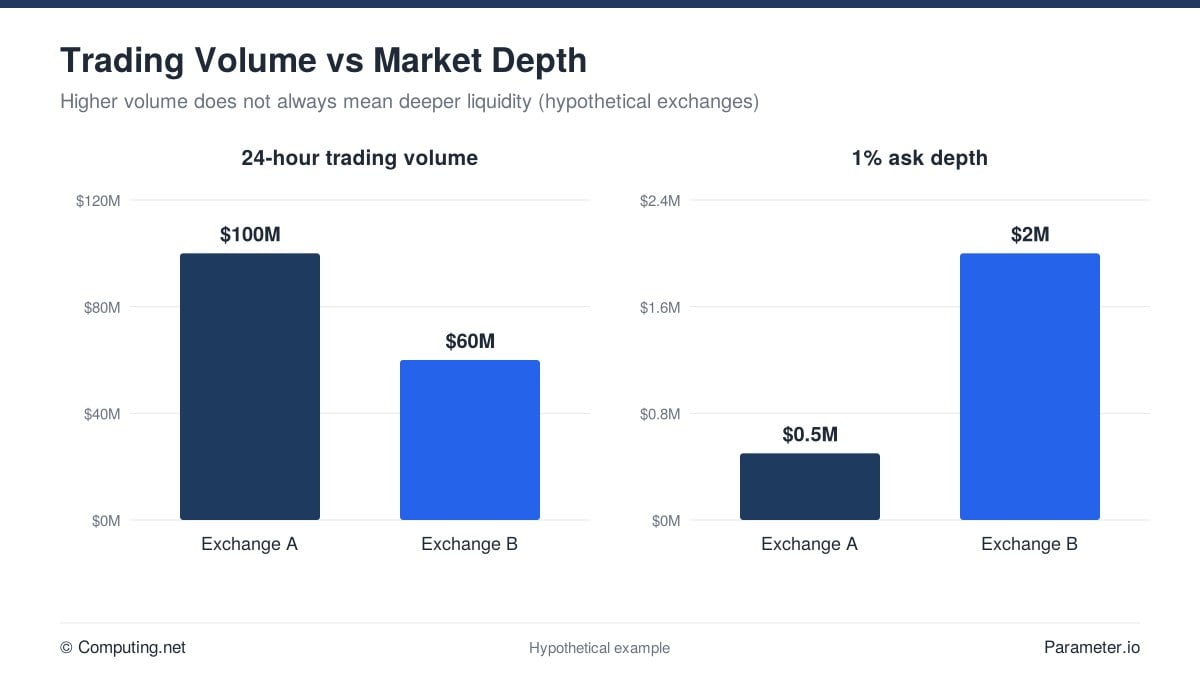
Depth counts open orders waiting to trade. Volume counts trades already completed over a period, often 24 hours.
High volume does not prove a market is deep. Fast automated trading can create large volume while few orders stay on the book.
| Exchange | 24-hour volume | 1% ask depth | Depth as share of volume |
|---|---|---|---|
| Exchange A | $100 million | $500,000 | 0.5% |
| Exchange B | $60 million | $2 million | 3.3% |
For a large instant purchase, Exchange B may give a better result despite lower volume. The outcome would still depend on how its orders are spread and whether they stay in place.
Kraken’s research says spreads, depth and order-book stability should be judged together rather than relying on volume alone. Liquidity is often split into four parts.
| Part | Question it answers |
|---|---|
| Tightness | How narrow is the bid-ask spread? |
| Depth | How much can be traded near the current price? |
| Immediacy | How fast can a trade be completed? |
| Resilience | How fast does liquidity return after a large trade or shock? |
Bitcoin and Ethereum usually have deeper books than small tokens because they draw more traders, institutions and market makers. Depth still varies by exchange and by trading pair, so BTC/USDT and BTC/EUR on one platform can behave differently.
Market capitalisation is not a measure of liquidity. A token can have a large reported value while offering little depth that can be traded.
Depth also differs between exchanges for the same coin. Customer numbers, market-maker deals, fee rebates for adding orders and regional trading habits all play a part.
Euro-based markets, for example, can trade on different patterns from dollar-based ones. A trade that moves the price 1% on one platform might move it far less on another.
The fair way to compare venues is to use the exact asset, pair and order size. The cheapest listed commission does not always produce the cheapest trade once spread and slippage are added.
When Displayed Liquidity Falls Short
Market makers place buy and sell orders on both sides of the book. A market maker quoting a $79,995 bid and an $80,005 ask earns the $10 spread if it buys and sells equal amounts, before costs.
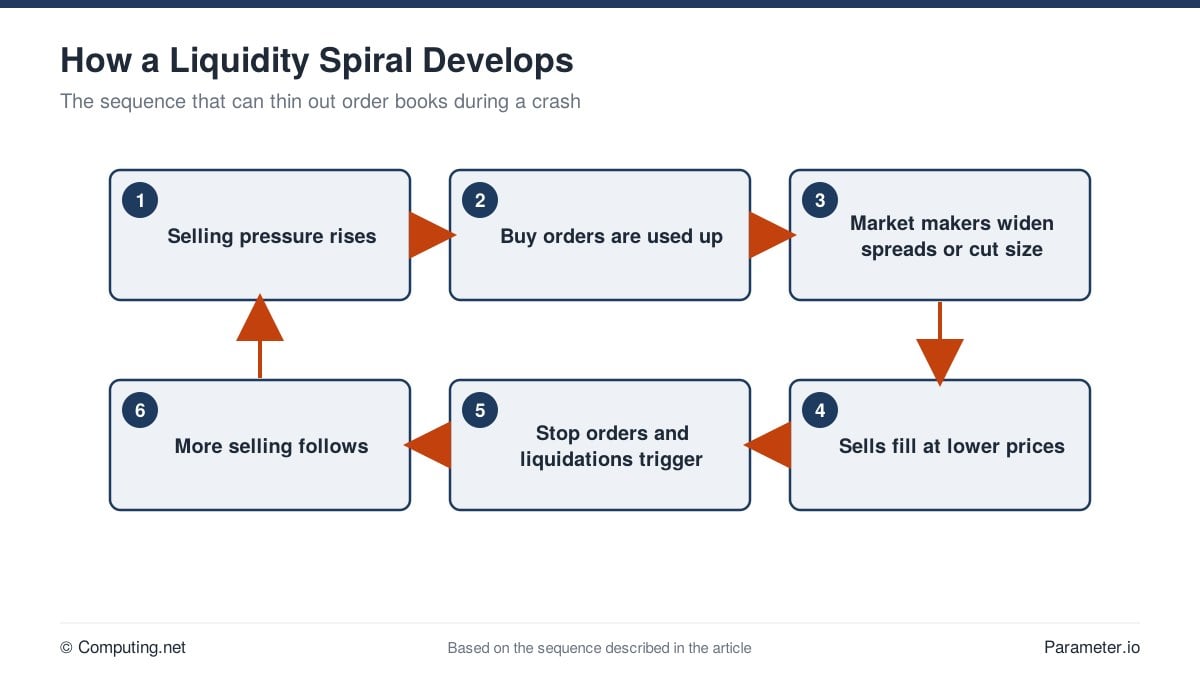
When prices swing fast, market makers may widen spreads or cut order sizes to protect themselves. Kraken lists order-book stability as a key measure for this reason.
In a crash this can feed on itself. The sequence in the chart below shows how thinning bids can push prices lower step by step.
Prices are set by the latest trades. If few buy orders exist, a small amount of selling can drop the price, and market value is then recalculated on the full supply at that lower price.
Displayed orders can also mislead. Spoofing means placing large orders with no plan to fill them, to create a false picture of supply or demand.
Kraken and CME Group both treat spoofing and layering as market abuse. Not every cancelled order is spoofing, since normal traders change orders all the time and the issue is intent.
Some liquidity is hidden. Coinbase’s trading rules describe iceberg orders, where only part of the size is shown in public market data.
| Data level | What it shows | Typical user |
|---|---|---|
| Level 1 | Best bid, best ask and last trade price | Quick price checks |
| Level 2 | Total orders at each price level | Most retail traders estimating slippage |
| Level 3 | Individual orders, often with IDs and timestamps | Algorithmic and professional traders |
For most retail investors, Level 2 data is enough. Level 3 data mainly helps traders who study queue position and how orders are filled.
Kraken’s 2026 API guide explains that Level 2 data is useful for estimating slippage. These levels are not the same as blockchain Layer 1 and Layer 2 networks.
Checklist before a large trade
| Step | What to check |
|---|---|
| 1 | The exact trading pair, such as BTC/USD or BTC/EUR |
| 2 | The bid-ask spread |
| 3 | Ask depth for a purchase, or bid depth for a sale |
| 4 | Order size compared with nearby depth |
| 5 | Estimated average execution price |
| 6 | Whether large orders stay in place over time |
| 7 | Depth and total cost on other exchanges |
| 8 | Market, limit or staged order |
| 9 | Fees, spread and slippage combined |
| 10 | The book again, just before placing the order |
Several common mistakes can distort a reading of the book. These include treating open orders as completed trades, using the wrong side of the book, and judging liquidity by daily volume alone.
Other errors include ignoring trade size, assuming a buy wall guarantees support, and forgetting that depth can drop when markets turn volatile.
Staged orders split a large trade into smaller pieces over time. Coinbase offers time-weighted average price (TWAP) orders for this, though prices can move against the trader before the full order is done.
The Bottom Line
The figures in this article point to one idea. The price on screen is not the same as the price a trader can get for a meaningful amount.
The worked examples show a 0.025% spread on Bitcoin against 10% on a thin token, and 3% slippage on a modest token purchase. Spread, depth, order stability and volume each tell part of the story.
Depth can also vanish when it is needed most. Checking the order book, comparing venues and choosing the right order type can help keep trading costs in view.
Sources
- Coinbase: What Is an Order Book?
- Coinbase: Advanced Trading Dashboard Overview
- Kraken: Why Liquidity Is an Important Metric in Crypto Markets
- Kraken: The Markets Series, Liquidity and Market Impact
- Kraken: Trading Glossary
- Coinbase: Understanding Advanced Trade Order Types
- Kraken: Market Integrity
- Kraken: Market Data Feeds Systematic Traders Use
- Coinbase: Exchange Trading Rules
- CME Group: Disruptive Trading Practices
This article is for information only and is not financial or investment advice. Crypto markets are volatile, and order-book liquidity can change quickly.


