


Key Highlights
- LINK climbed to approximately $12.11, marking a 24-hour gain of roughly 6.2% following a bounce from the $11 support zone.
- Crypto analyst Hov identified completion of a five-wave pattern originating from September lows, suggesting potential for additional upward movement.
- Immediate price resistance is positioned near $12.80-$13, with further barriers around $15.
- The Chainlink strategic reserve accumulated approximately 97,500 LINK tokens valued at $1.1 million, bringing cumulative holdings to 5.96 million LINK.
- Analyst Quinten François noted that LINK hit $55 in 2021 before the implementation of many current enterprise integrations and reserve initiatives.
Chainlink has reclaimed the $12 level after bouncing from recent support floors, with market participants monitoring the $12.80-$13 resistance zone closely.
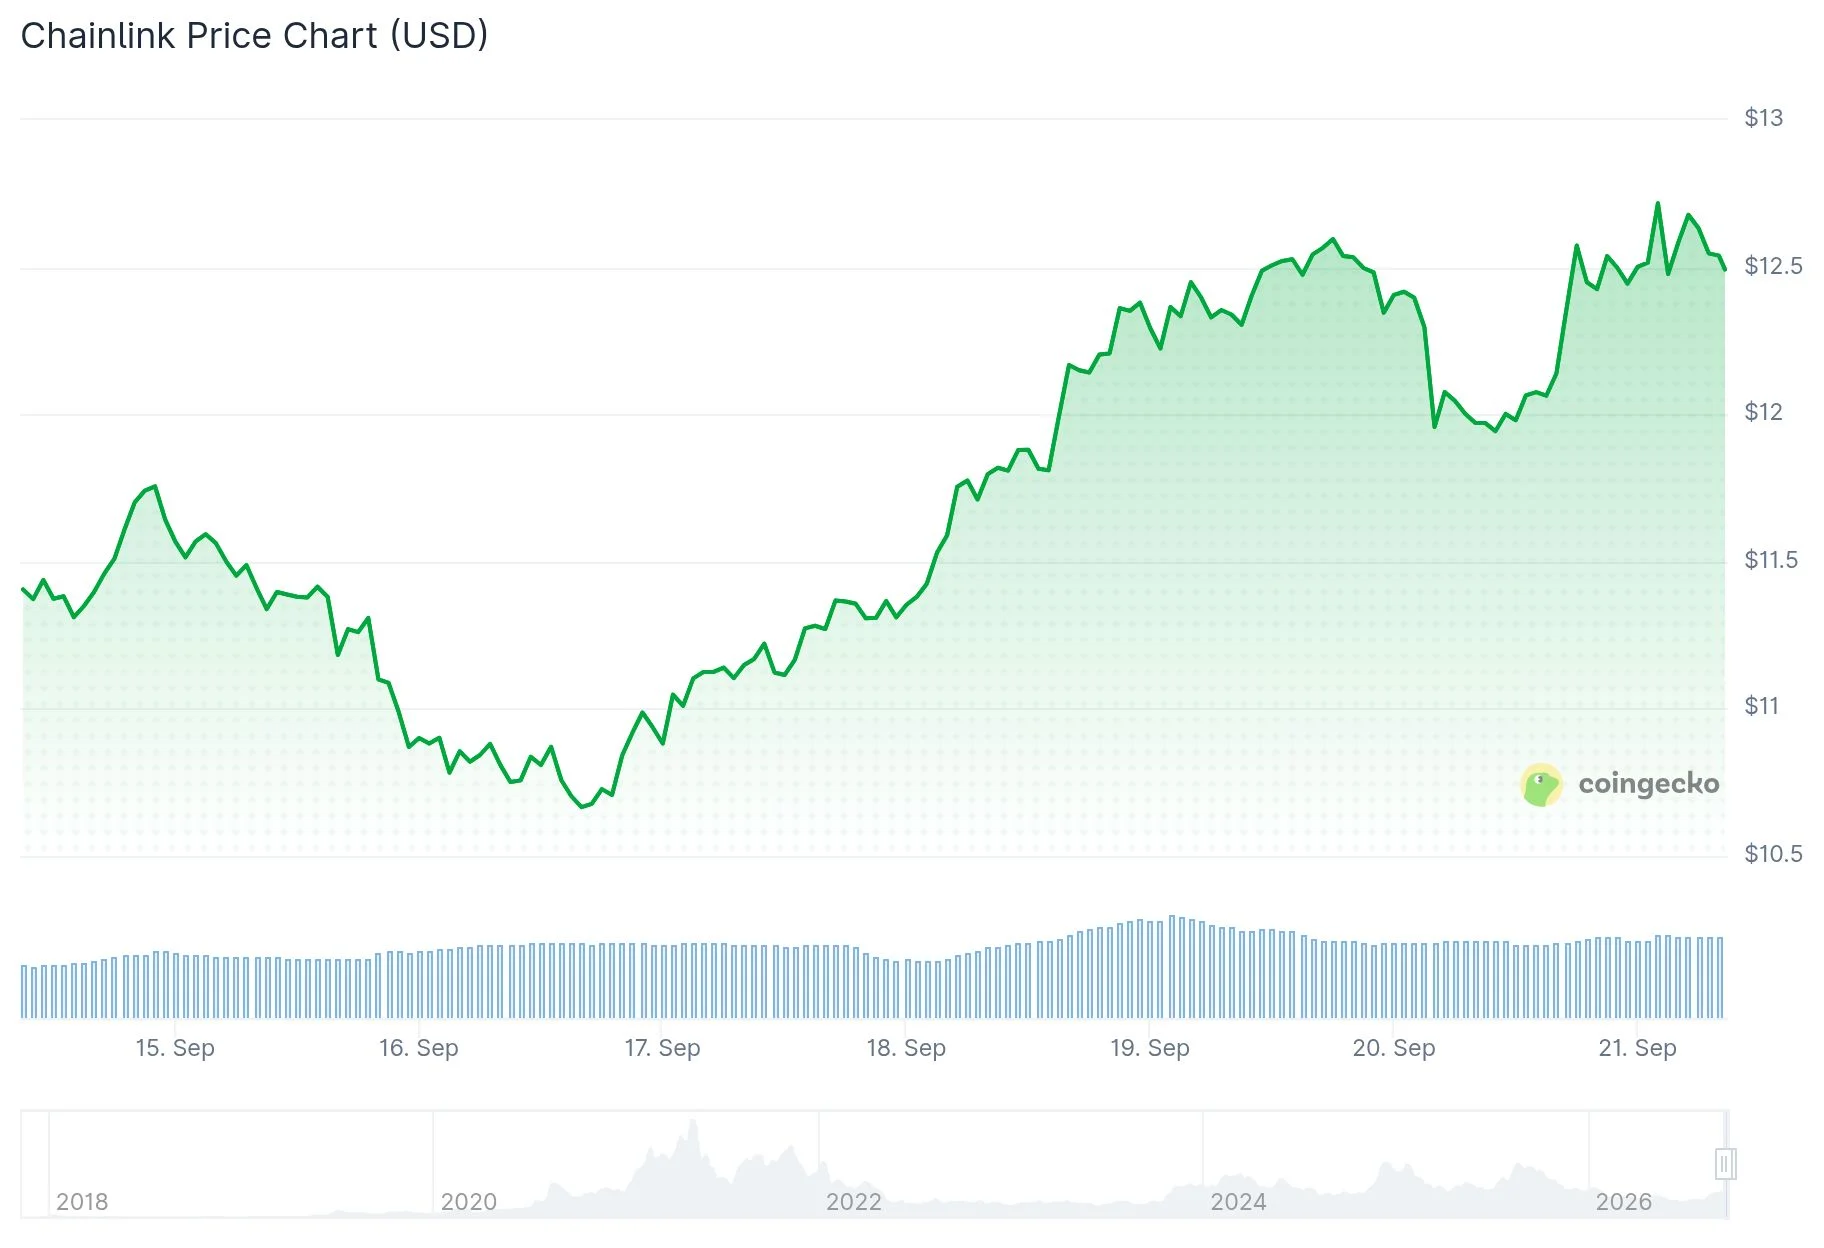
The token’s price hovered around $12.11, reflecting a 6.21% increase across the previous 24-hour period. During the trading session, LINK fluctuated within a range of $11.25 to $12.22.
Data indicated 24-hour trading volume approached $538.65 million, while the network’s total market capitalization reached approximately $9.06 billion.
This upward movement emerged after the token found support near the $10.70-$11 weekly level, a price region that has consistently generated buying interest.
Elliott Wave Pattern Emerges as LINK Approaches $13 Threshold
Market analyst Hov identified that LINK has finished a five-wave progression starting from its September bottom.

According to Hov’s technical framework, there’s potential for additional upside through either a Wave C or Wave 3 formation before a significant pullback materializes.
The analyst suggested the recent peak might constitute an expanded Wave 4 pattern. In this scenario, a subsequent bullish wave could theoretically push prices toward $51.
This projection represents a long-term technical possibility rather than an immediate price forecast.
Examining the four-hour timeframe, LINK has rebounded from approximately $10.60 to above $12. The upper Bollinger Band is positioned around $12.93, with the middle band near $11.73 serving as immediate support.
The MACD indicator has moved above its signal line, with histogram bars remaining in positive territory.
Futures market metrics present a mixed picture. According to Coinglass, trading volume declined 14.91%, though open interest climbed 1.78%.
Strategic Reserve Maintains Steady LINK Acquisition
Blockchain analytics from Onchain Lens revealed that the Chainlink Reserve acquired approximately 97,500 LINK tokens valued at around $1.1 million.
Over the preceding 30-day period, the reserve reportedly gathered roughly 480,700 LINK worth $5.5 million. Combined holdings now total approximately 5.96 million LINK, representing about $68.71 million in value.
Analyst Quinten François provided perspective on LINK’s historical context via X. He emphasized that the token achieved approximately $55 in 2021 prior to implementing SWIFT and CCIP collaborations, DTCC partnerships, reserve programs, institutional tokenization efforts, and various other enterprise applications currently active.
A long-term price chart accompanying his analysis displays LINK nearing a downward-sloping resistance trendline extending from its 2021 all-time high.
Currently, LINK trades beneath this multi-year trendline while challenging the more immediate $12-$13 resistance barrier, with $11 representing the nearest support level.
Get 3 Free Stock Ebooks
Discover top-performing stocks in AI, Crypto, and Technology with expert analysis.
- Top 10 AI Stocks - Leading AI companies
- Top 10 Crypto Stocks - Blockchain leaders
- Top 10 Tech Stocks - Tech giants


