



Key Highlights
- Crypto analyst Ali Martinez identifies bullish market structure for SOL with $150 price objective expected this month
- SOL reached $101.30 on September 1, marking a 40% increase across the previous 30 days
- Solana-based ETFs attracted $925K in net inflows, pushing aggregate assets under management to $1.44 billion
- The network registered 5.2 billion non-vote transactions during August, establishing a new record — representing a 23% jump from July’s figures
- Price must maintain support at $100 and breach $120 resistance for the $150 projection to materialize
Solana (SOL) maintains trading levels near $101 following a robust monthly advance, prompting one market analyst to forecast a potential climb toward $150 before September concludes.
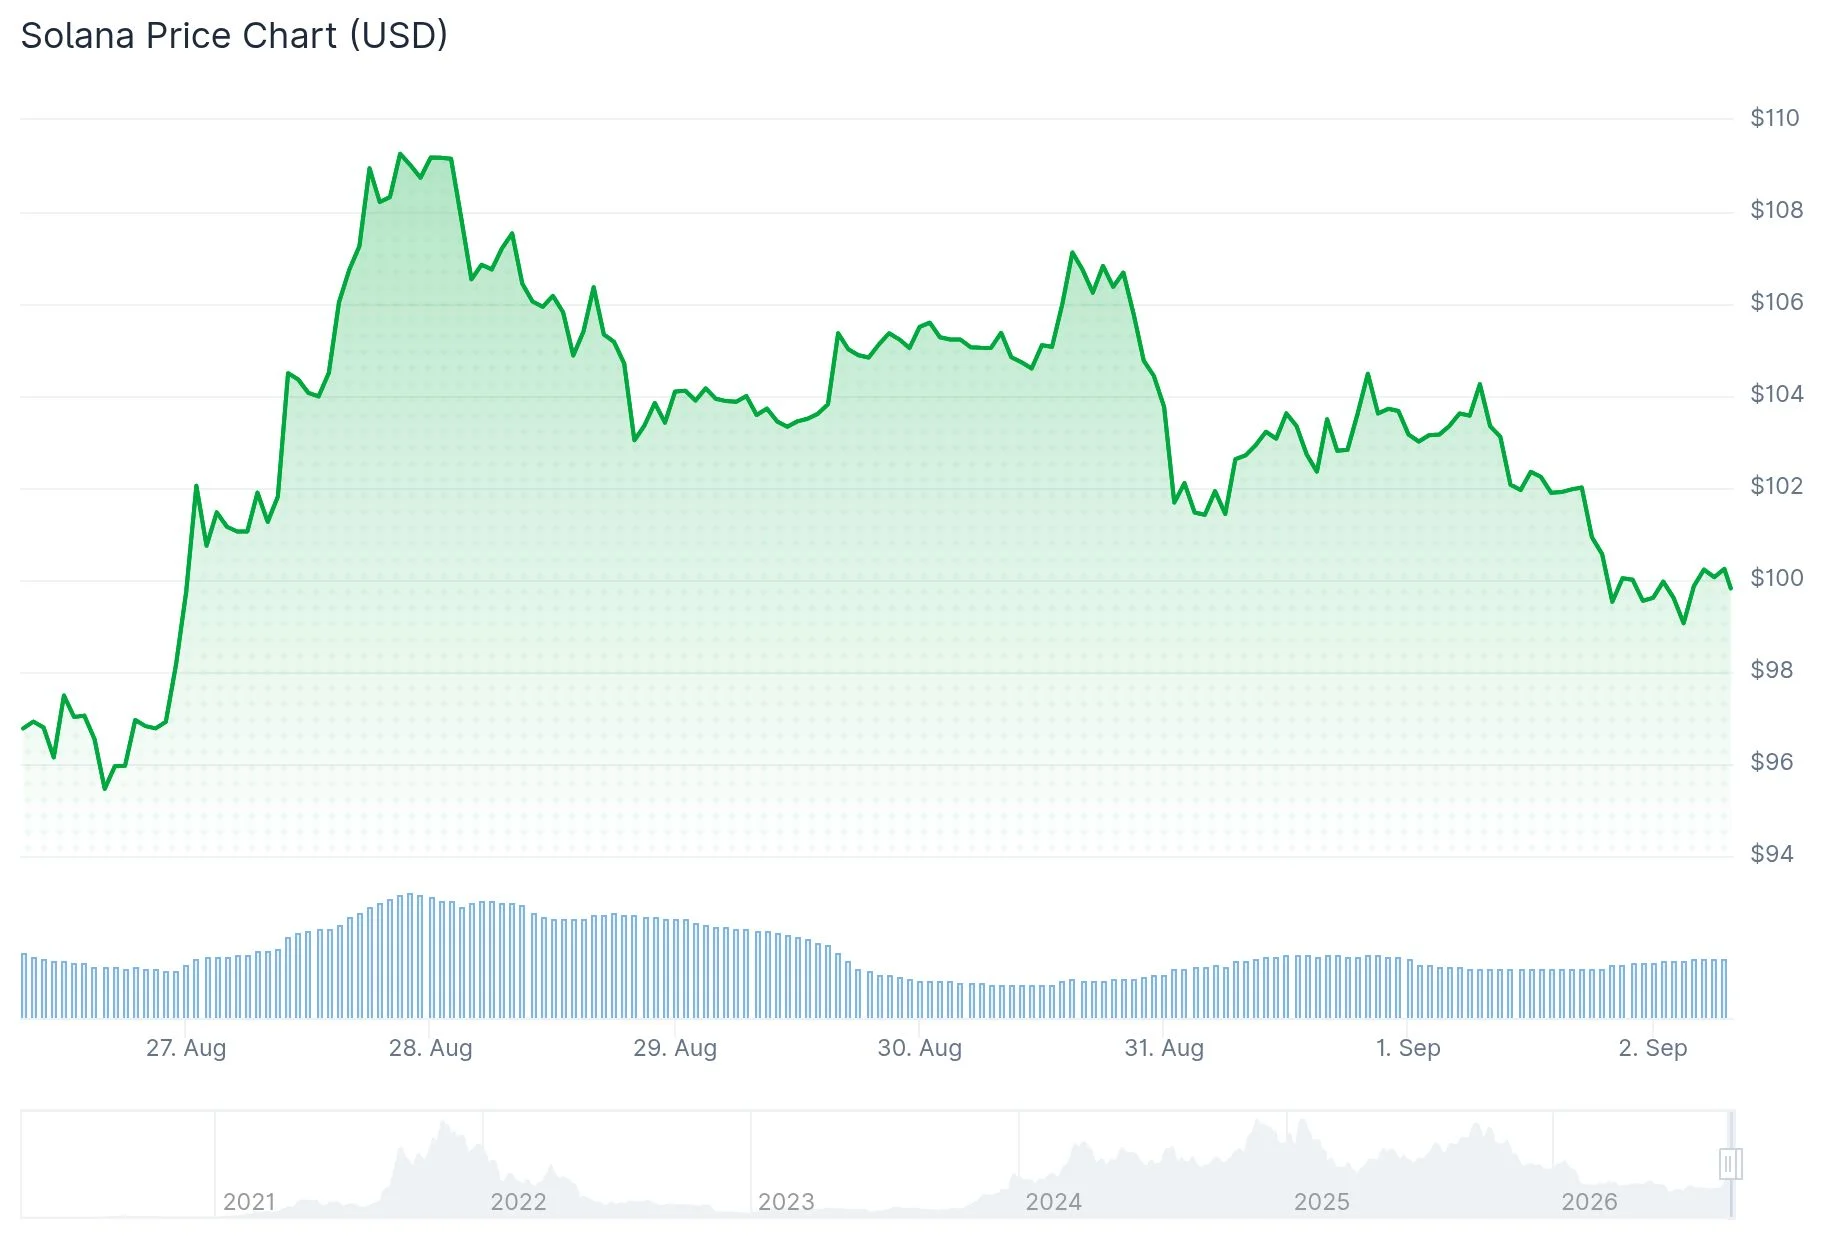
SOL experienced a 1.76% decline during the 24-hour period ending September 1, settling at $101.30. However, this minor retracement doesn’t overshadow the asset’s 5% weekly appreciation and impressive 40%+ monthly gains.
The wider cryptocurrency sector experienced modest weakness, with aggregate market capitalization slipping 0.65% to $2.62 trillion. Bitcoin remained below the $78,000 threshold, Ethereum exchanged hands near $2,430, while XRP fluctuated around $1.36.
The Fear and Greed Index retreated from 80 to 74, suggesting a modest tempering of market enthusiasm despite the sector’s robust 21.38% monthly advance.
Analyst’s Bullish Outlook
Cryptocurrency market analyst Ali Martinez shared his perspective on X, urging traders to abandon pessimistic stances on Solana. According to Martinez, the technical configuration is shifting toward bullish territory, recommending market participants establish positions ahead of the anticipated upward movement. His analysis points to $150 as the subsequent price objective for SOL.

Martinez stated: “Stop being bearish on Solana $SOL. The setup is turning bullish, and I think it’s time to lock in before the next major move.”
From a technical standpoint, achieving the $150 objective requires SOL to initially surpass $110, followed by clearing the $120 resistance zone. Successfully breaking above $120 would potentially unlock progression toward $130 en route to $150. Should SOL relinquish the $100 threshold, the subsequent crucial support zone appears at $95.
Present technical metrics paint a nuanced picture. The Relative Strength Index registers 40.56, positioned above oversold conditions. The MACD indicator shows -0.18, accompanied by a histogram reading of -0.46, suggesting near-term range-bound behavior.
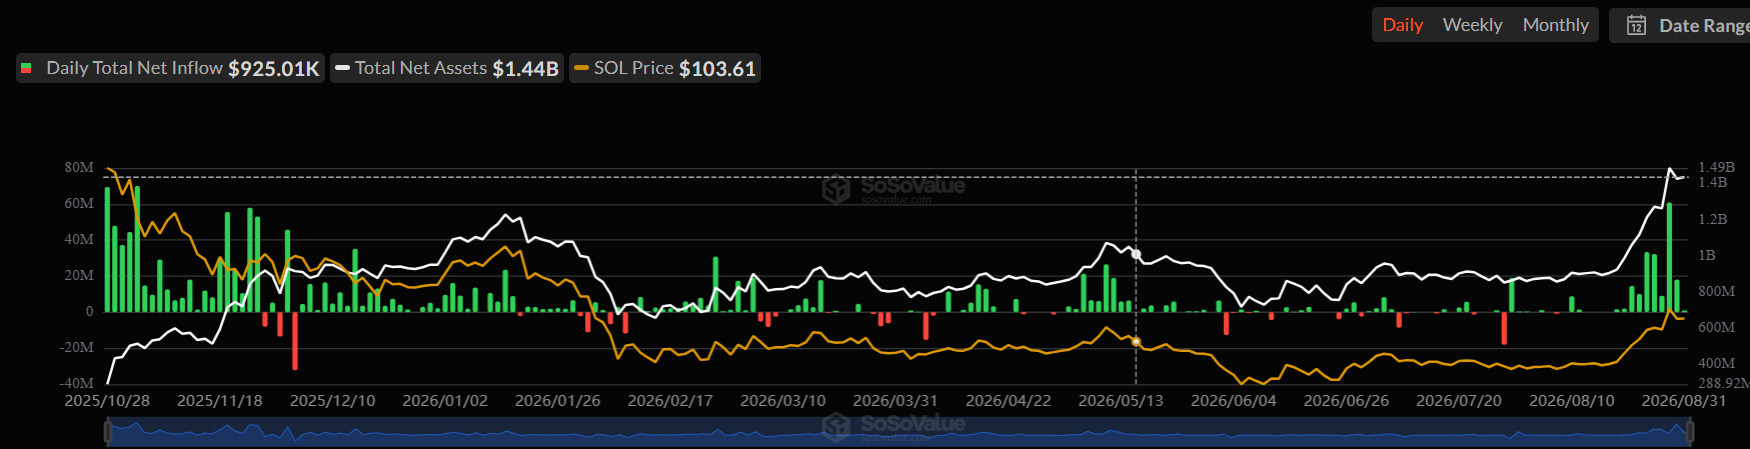
Solana-focused ETFs captured $925,010 in net inflows on August 31, exclusively directed to Fidelity’s FSOL product. Aggregate ETF holdings have climbed to $1.44 billion, representing 2.37% of SOL’s complete market capitalization. Cumulative trading activity across all seven investment vehicles has generated $67.55 million since their introduction.
Network Usage Reaches Unprecedented Levels
From a network perspective, Solana executed over 5.2 billion non-vote transactions throughout August 2026, based on Blockworks analytics. This represents an unprecedented milestone, climbing 23% above July’s former record of 4.24 billion.
Non-vote transaction metrics capture genuine user and application engagement, filtering out routine validator maintenance operations. The August data point exceeds Solana’s standard monthly volume from 18 months prior by more than 100%.
Stablecoin circulation on Solana climbed to $14.7 billion in August, approaching triple the $5 billion observed twelve months earlier.
This achievement arrived following Solana’s inaugural validator governance ballot, where two of three measures achieved approval, including an initiative to accelerate the reduction rate of new SOL token emissions by a factor of two annually.
Get 3 Free Stock Ebooks
Discover top-performing stocks in AI, Crypto, and Technology with expert analysis.
- Top 10 AI Stocks - Leading AI companies
- Top 10 Crypto Stocks - Blockchain leaders
- Top 10 Tech Stocks - Tech giants


