


Key Highlights
- Ethereum advanced 1.95% to reach $1,912, successfully recapturing the $1,900 threshold after support held firm at $1,870
- ETH price settled above its 20-day, 50-day, and 100-day moving averages, reinforcing bullish momentum
- Major whale withdrew 5,300 ETH valued at $9.98 million from Kraken, reducing available exchange inventory
- Total staked Ethereum reached an all-time high of 41 million tokens, representing more than 33% of total supply in circulation
- Market analyst Michaël van de Poppe projects potential rally to $2,800 following a decisive break above the $2,000 barrier
Ethereum posted a solid 1.95% gain on August 17, reaching $1,912 as market participants defended crucial support around $1,872 during the trading session. This upward movement successfully brought ETH back above the psychologically important $1,900 threshold.
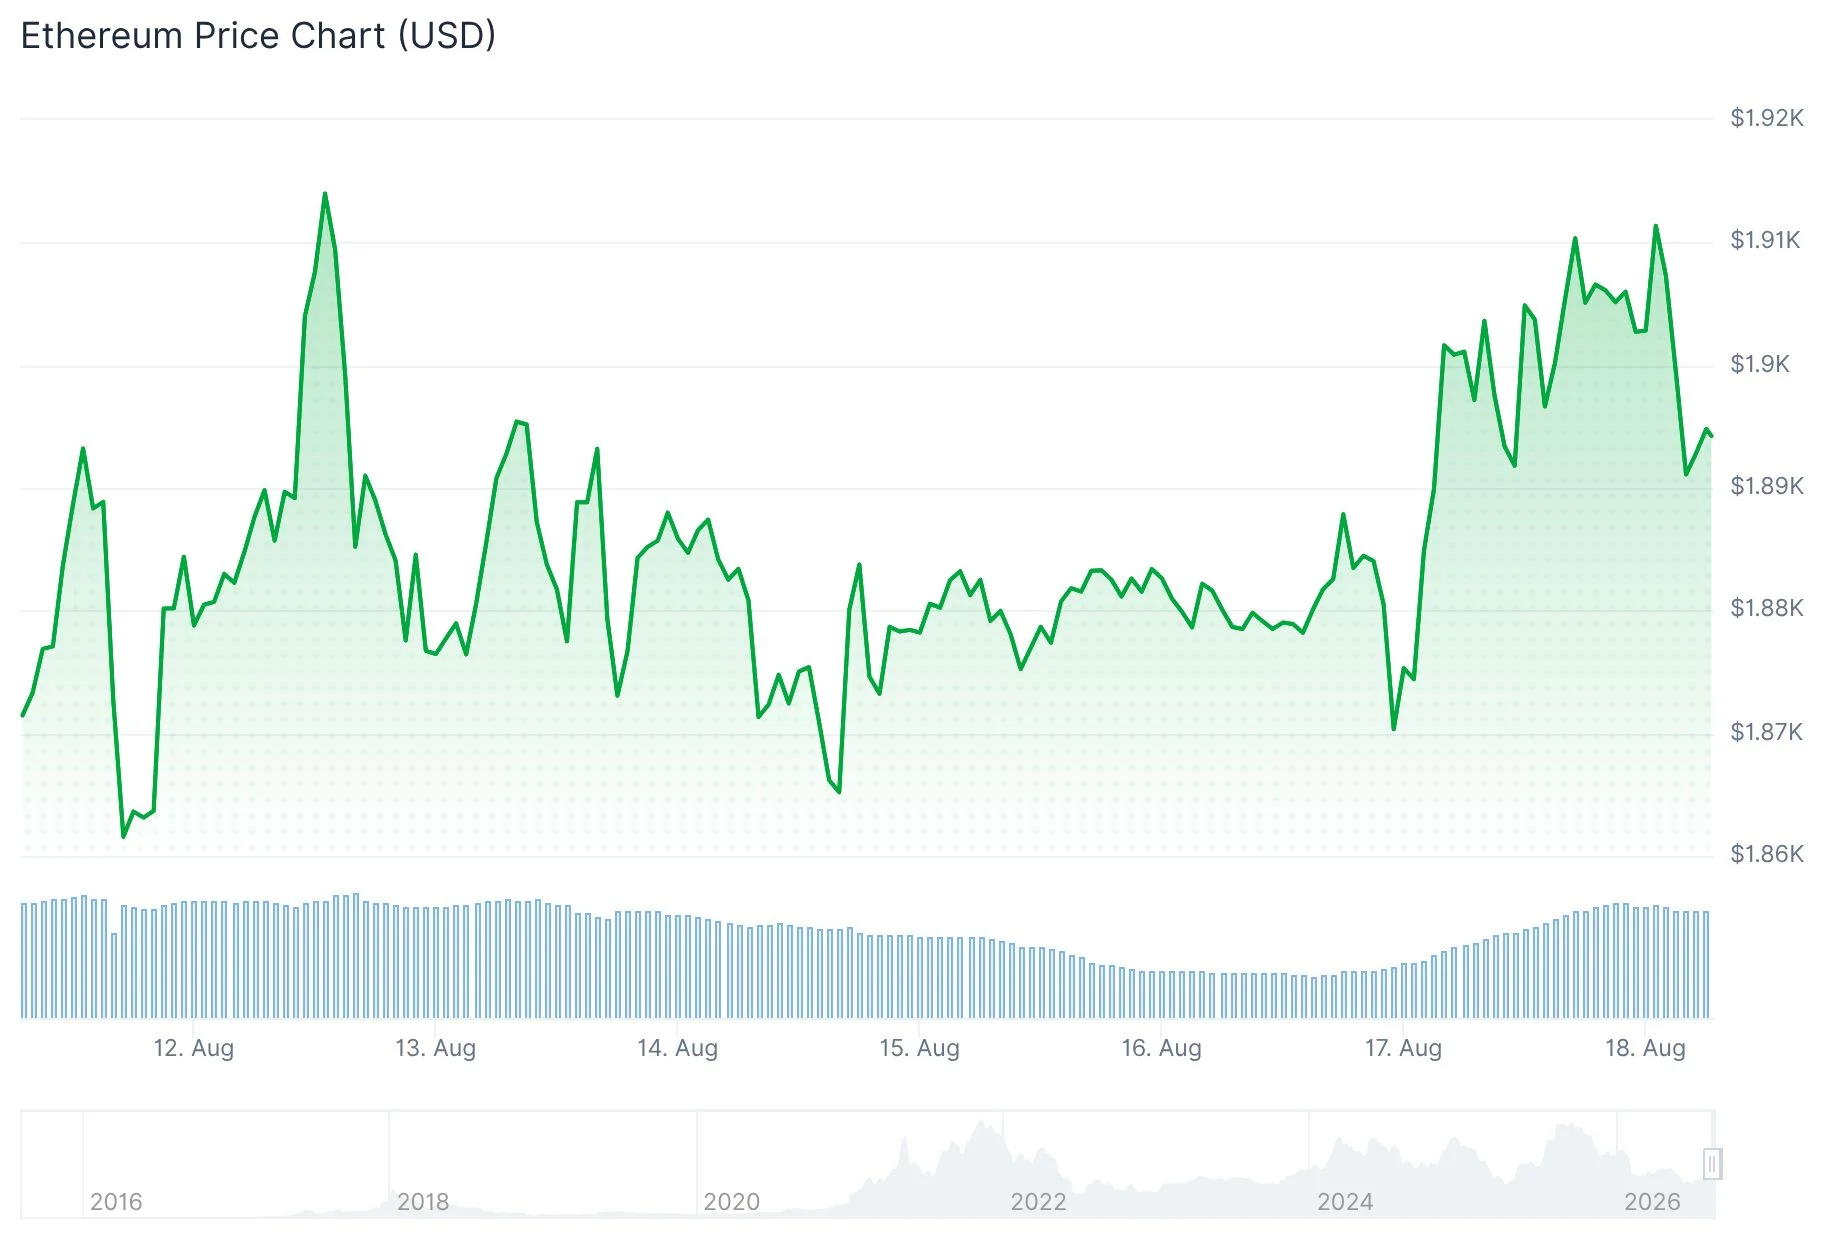
The second-largest cryptocurrency by market capitalization finished the day above its 20-day simple moving average at $1,889, 50-day SMA at $1,845, and 100-day SMA positioned at $1,869. This technical positioning maintains a favorable setup for continued upside momentum.
The Relative Strength Index on the daily chart climbed to 56.5, surpassing its signal line average of 53. This indicates momentum has shifted in favor of buyers, although the reading suggests substantial room exists before reaching overbought conditions.
ETH is still trading beneath its 200-day simple moving average, currently located at $2,009. This positions the $2,000–$2,010 range as the critical resistance zone that will determine the next directional move.
Fundstrat’s co-founder Tom Lee shared a technical chart from analyst MacroCRG, highlighting that ETH currently trades approximately 3.5% below its daily Ichimoku Cloud. Lee expressed optimism about a potential breakthrough above this technical indicator — a feat Ethereum hasn’t accomplished since October 2025.

Major Whale Movements and Exchange Supply Dynamics
A significant crypto whale executed a withdrawal of 5,300 ETH from the Kraken exchange, representing approximately $9.98 million in value. Such large-scale withdrawals remove substantial supply from readily available trading inventory on centralized platforms.
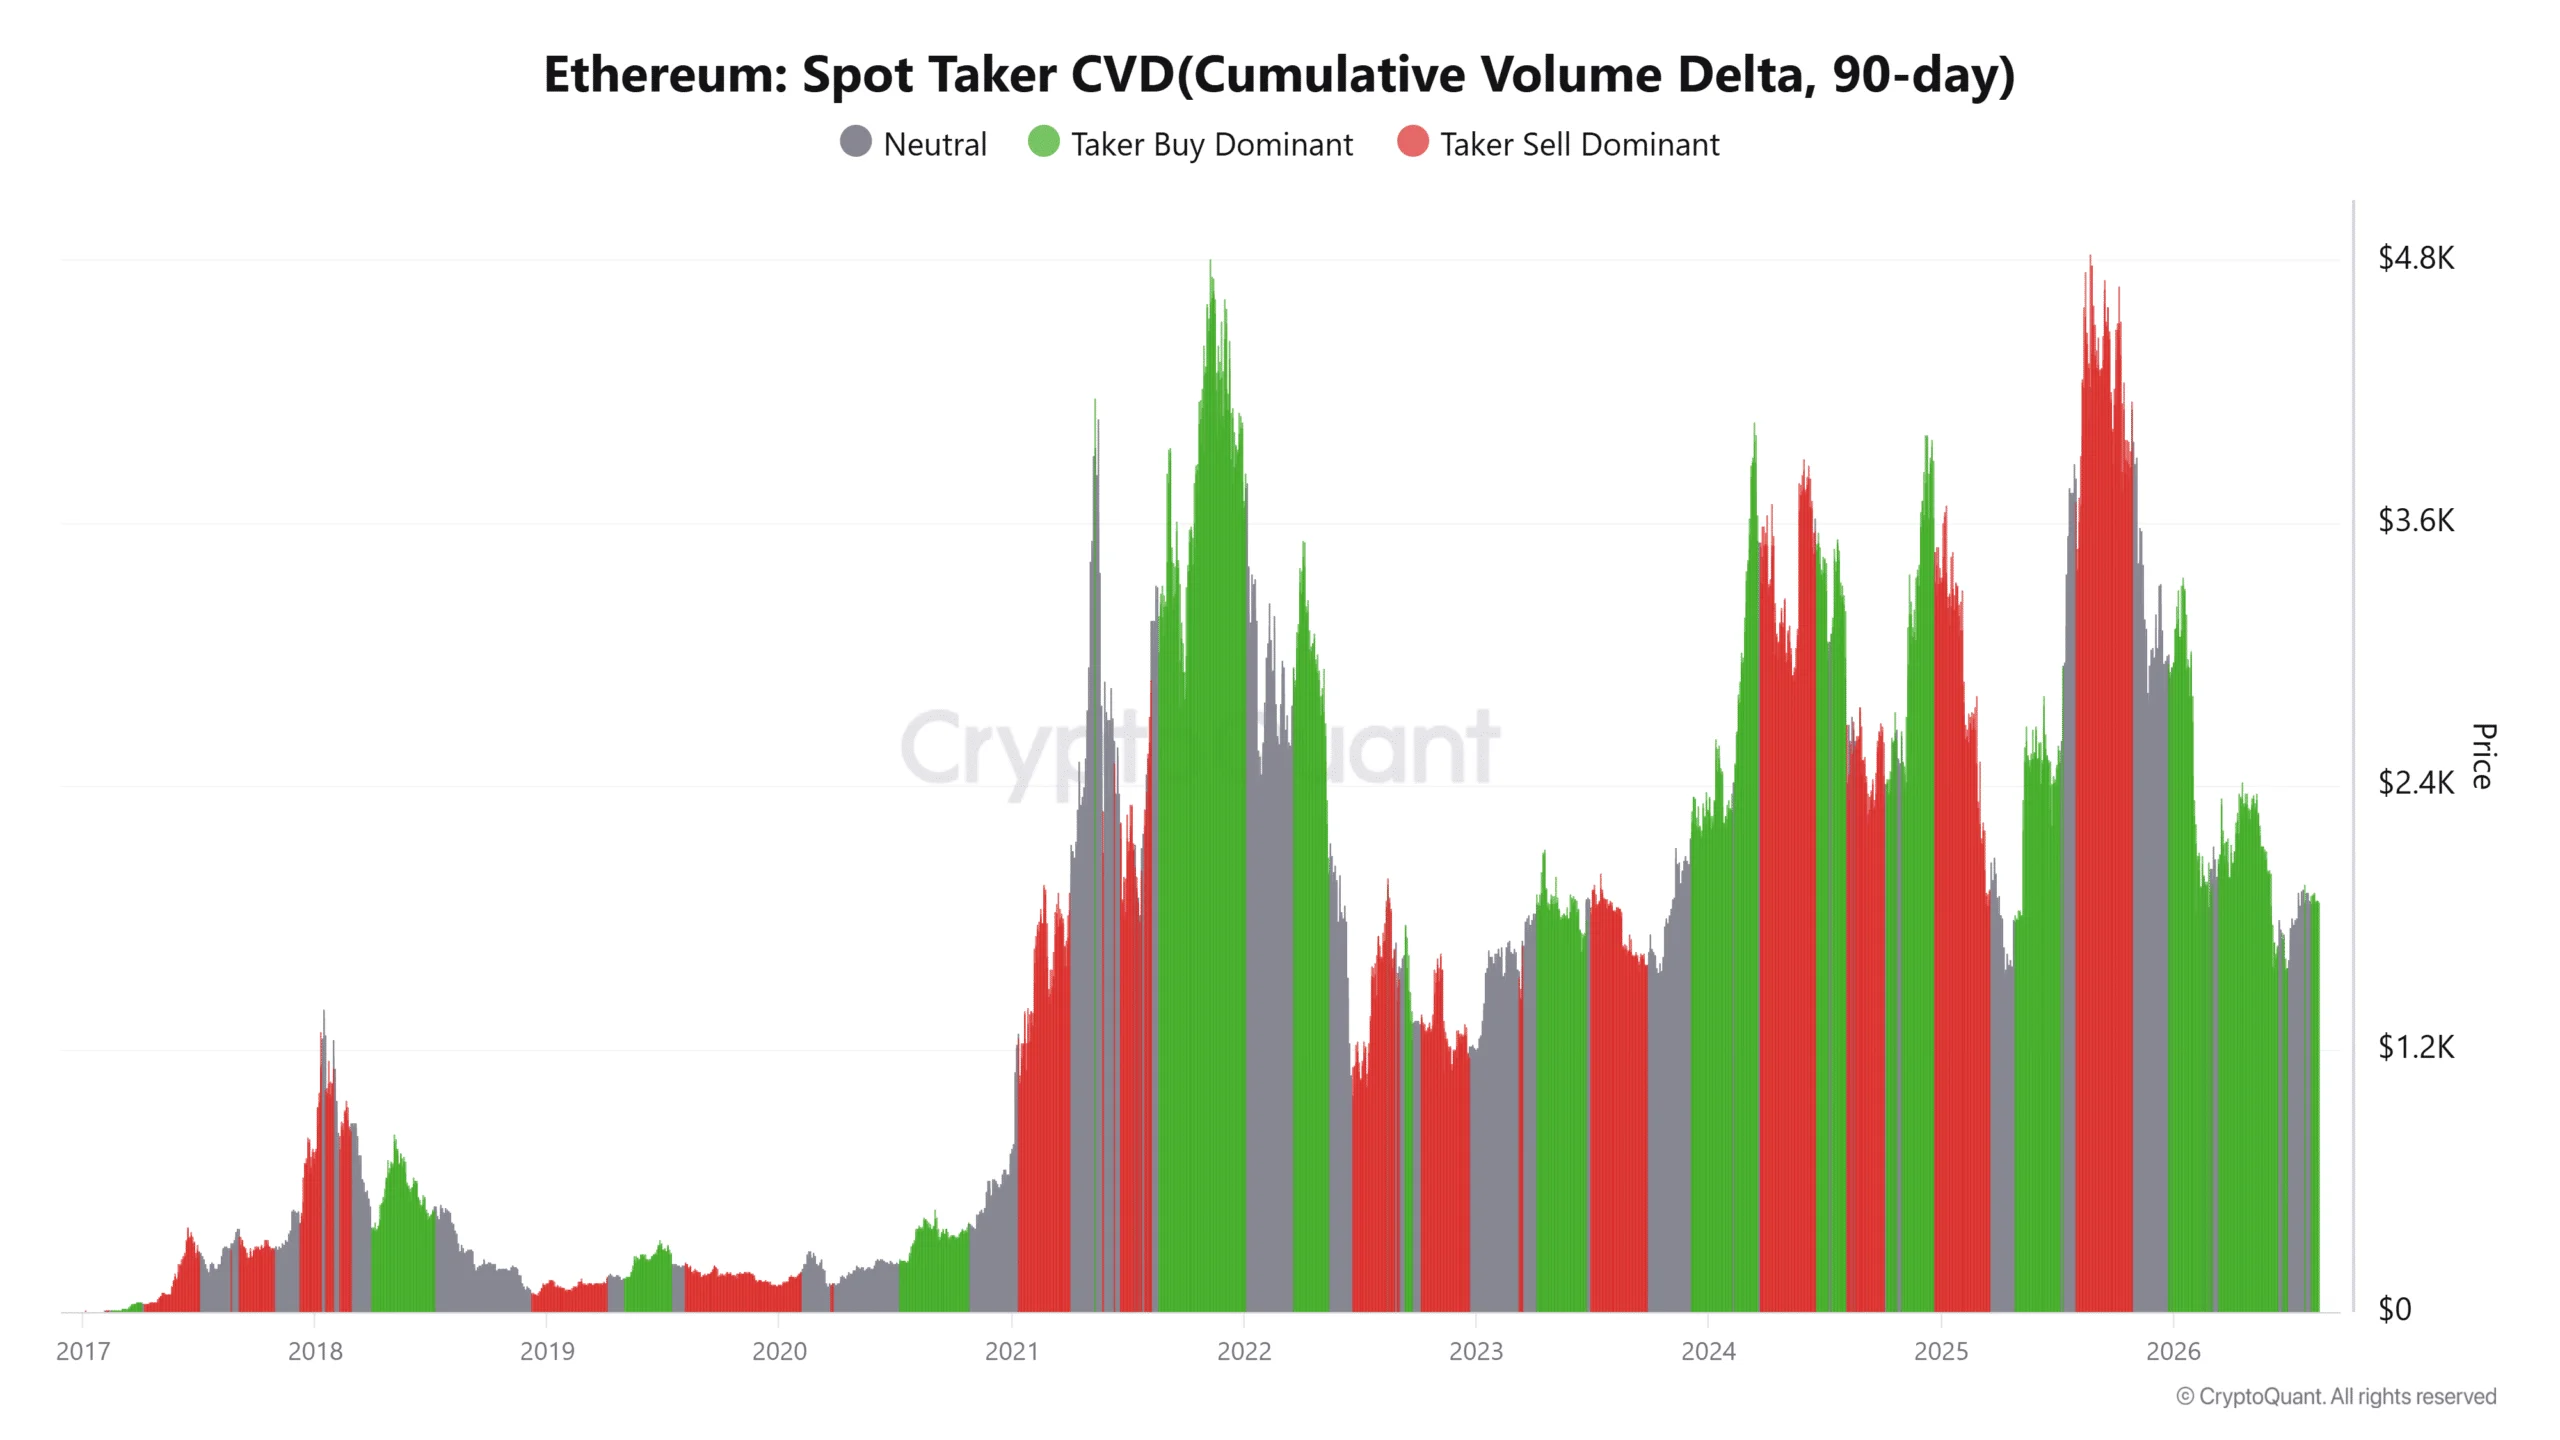
The Spot Taker Cumulative Volume Delta indicator has shifted into buyer-dominant territory following an extended period of neutrality. This metric reveals that market participants are increasingly willing to aggressively lift offers rather than wait for passive fills, confirming an accumulation pattern.
Ethereum’s total staking volume achieved an unprecedented milestone of 41 million ETH, accounting for approximately 33.8% of the entire circulating token supply. This substantial portion of locked ETH strengthens the fundamental case for a supply constraint scenario.
Critical Price Levels and Liquidation Zones
Liquidation tracking data from CoinGlass reveals dense clusters of short positions concentrated near $1,925 and within the $1,945–$1,950 range. A push through these levels would likely trigger forced liquidations, creating additional buying momentum.
Looking at downside risk, the $1,870 support level represents a critical line in the sand. Analyst Michaël van de Poppe cautioned via social media platform X that a breakdown below $1,870 could rapidly accelerate ETH toward prices below $1,700, driven by substantial long position liquidity positioned beneath current market levels.
Van de Poppe noted that Ethereum’s daily chart structure is “looking better day after day,” pointing to a consistent pattern of ascending highs and ascending lows. He suggested that a clean breakout above $2,000 could trigger rapid price appreciation, potentially pausing briefly near $2,200 before extending toward a $2,800 objective.
United States-based spot Ethereum exchange-traded funds experienced net outflows totaling $2.26 million during the trading week spanning August 10–14. BlackRock’s ETHA product specifically recorded $16.39 million in redemptions, indicating institutional demand through ETF vehicles has yet to validate the recent price recovery.
The Average Directional Index registered approximately 18.50 at the time of this analysis, suggesting directional conviction remains insufficient for confirming a sustained trending environment.
Get 3 Free Stock Ebooks
Discover top-performing stocks in AI, Crypto, and Technology with expert analysis.
- Top 10 AI Stocks - Leading AI companies
- Top 10 Crypto Stocks - Blockchain leaders
- Top 10 Tech Stocks - Tech giants


